
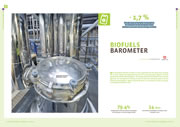
 La consommation de biocarburants a progressé de 9,2% dans l’Union européenne en 2017
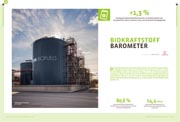
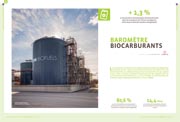
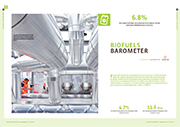
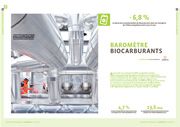
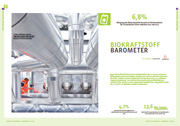
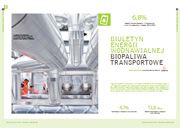
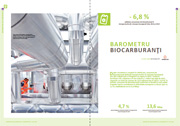
La période d’incertitude sur le devenir des biocarburants a pris fin avec les accords sur les grandes lignes de la future directive énergies renouvelables, la RED 2. Ces clarifications et l’encadrement proposé du développement des biocarburants devraient permettre de mieux structurer la filière dans le sens premier des objectifs du prochain paquet climat énergie, à savoir la lutte contre le réchauffement climatique. Ce dénouement attendu se ressent au niveau des chiffres de consommation de biocarburants dans les transports. Après plusieurs années de stabilisation, celle-ci repart à la hausse en 2017 (+ 9,2 %), pour atteindre 15,5 Mtep.
All posts by EurObserv'ER
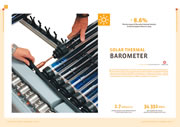
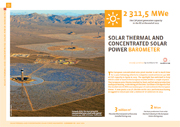
Solar thermal and concentrated solar power barometer 2018
 -24,2 % The decrease of the solar thermal market in the European Union in 2017
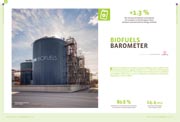
Solar thermal energy is no doubt the ultimate physical form for transferring heat to water without emitting greenhouse gases or pollutants. Yet in 2017 the sector struggled to survive in the hot water production and heating market. According to EurObserv’ER, the annual solar thermal collector surface area in the European Union dropped below the 2 million m2 mark, i.e. by 24.2% compared to the previous year’s installed surface area. The individual national market figures vary widely, with several countries showing encouraging signs.
Download in English
Download in other languages : ![]()
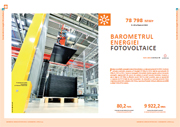
Baromètres solaire thermique et solaire thermodynamique 2018
-24,2 % la baisse du marché solaire thermique de l’Union européenne en 2017.
Le solaire thermique est certainement la forme ultime du point de vue physique pour transférer de la chaleur à de l’eau sans aucune émission de gaz à effet de serre et sans émettre de polluants. La filière peine cependant à s’imposer économiquement sur le marché de la production d’eau chaude et du chauffage. Selon EurObserv’ER, la surface annuelle de capteurs solaires thermiques de l’Union européenne est passé en 2017 sous la barre des 2 millions de m2, soit une baisse de 24,2 % par rapport aux surfaces installées en 2016. Au niveau des marchés nationaux, les situations sont plus contrastées avec toutefois quelques signes encourageants pour certains pays.
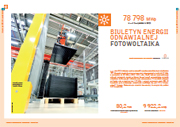
Baromètre Photovoltaïque 2018
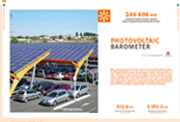
 106 606 MW de puissance photovoltaïque cumulée connectée fin 2017 dans l’Union européenne
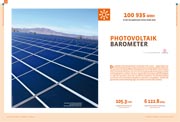
La croissance spectaculaire de l’électricité solaire, qui s’appuie sur des bases industrielles extrêmement solides, fait du photovoltaïque un des piliers de la transition énergétique mondiale. En 2017, ont été installés dans le monde près de 100 GW, dont un peu plus de la moitié en Chine. Le marché mondial a représenté à peine moins que la totalité du parc installé de l’Union européenne. Ce dernier culmine fin 2017 à 106,6 GW, soit 5,6 GW de plus qu’en 2016. Si la production photovoltaïque peut encore paraître arginale au niveau mondial, représentant un peu plus de 2 % du mix électrique en 2017, elle compte déjà pour près de 6 % au Japon, et plus de 7 % en Allemagne et en Italie.
Télécharger en Français
Download in other languages : ![]()
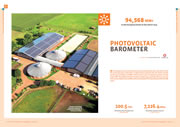
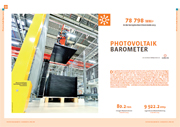
Photovoltaic barometer 2018
 106 606 MW Cumulative photovoltaic capacity in the European Union at the end of 2017
The spectacular growth of solar power based on solid industrial bases, makes photovoltaic one of the mainstays of global energy transition. In 2017, roughly 100 GW was installed worldwide, and just over half of that in China. The global market amounted to slightly less than half the European Union’s installed base. The EU ended the year at 106.6 GW, i.e. 5.6 GW more than in 2016. While at just over 2% in 2017 solar photovoltaic output may still seem negligible on a global level, photovoltaic already supplies about 6% of the electricity mix in Japan, and more than 7% in Germany and Italy.
Download in English
Download in other languages : ![]()
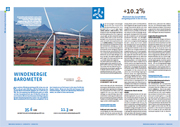
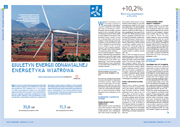
Baromètre éolien 2018
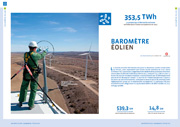 353,5 TWh : production d’électricité éolienne estimée dans l’Union européenne en 2017
Le marché mondial de l’éolien est pour la deuxième année consécutive en retrait, avec cependant une baisse moins sensible en 2017. Selon EurObserv’ER, la puissance supplémentaire déduite de la puissance mise hors service devrait être de l’ordre de 51 GW en 2017, comparé à 55,5 GW en 2016. La baisse du marché mondial s’explique essentiellement par un développement plus maîtrisé du marché chinois. Le marché de l’Union européenne a quant à lui connu un surcroît d’activité, anticipant la mise en place du nouveau cadre réglementaire voulu par la Commission européenne. La puissance du parc mondial franchit allègrement le cap du demi-million de MW installés en 2017, soit 539 256 MW.
Wind energy barometer 2018
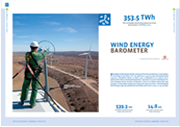 353,5 TWh : estimated electricity production from wind power in the EU in 2017
The global wind energy market contracted for the second year in succession. According to EurObserv’ER, the additional capacity, less decommissioned capacity, should be about 51 GW in 2017, compared to 55.5 GW in 2016. Restrained Chinese market development is the main reason for this downturn. The European Union market witnessed a flurry of activity before the new European Commission regulatory framework came into force. Installed global wind energy capacity passed the half-million MW mark in 2017, i.e. 539 256 MW.
Download in English
Download in other languages : ![]()
17th annual overview barometer
 EurObserv’ER has been gathering data on the European Union’s renewable energy sources for eighteen years for its themebased barometer reports on the state of the sectors and their momentum. The first part of this work is a summary of the barometers published in 2017 for the wind energy, solar photovoltaic, solar thermal, biofuel, biogas and solid biomass sectors.
The energy indicators drawn from these barometers have been updated with SHARES data from 26th January and supplemented by data on the sectors for which no individual barometers were published – small hydropower, heat pumps, geothermal energy, concentrated solar power, household refuse incineration and renewable marine energy sources. Continue reading 17th annual overview barometer
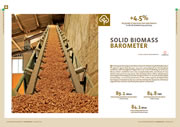
Solid biomass barometer 2017
 +3% growth of primary energy consumption from solid biomass in the EU between 2015 and 2016
Although 2016 was globally the hottest year on record for the third time running, it was cooler in some key European Union countries, which resulted in additional heating requirements, and thus wood fuel consumption. This trend pushed European Union solid biomass consumption (excluding charcoal) to the 100-Mtoe threshold in 2016, 98.5 Mtoe to be exact, and a rise of 2.9 Mtoe.
Baromètre biomasse solide 2017
+3% d’augmentation de la consommation d’énergie primaire de biomasse solide dans l’UE entre 2015 et 2016
Bien que pour la troisième année consécutive, un nouveau record de chaleur ait été enregistré à l’échelle mondiale, l’année 2016 a été moins douce dans quelques pays clés de l’Union européenne, ce qui a eu pour effet d’augmenter les besoins de chaleur, et donc la consommation de bois de chauffage. Cette tendance a poussé la consommation de biomasse solide (hors charbon de bois) de l’Union européenne au seuil des 100 Mtep durant l’année 2016, 98,5 Mtep exactement, soit 2,9 Mtep supplémentaires.
Biogas barometer 2017
 + 3.0 % Biogas primary energy production growth in 2016.
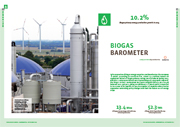
Biogas has crossed a new threshold in the European Union, as EurObserv’ER puts primary energy output in 2016 at more than 16 million tonnes of oil equivalent. Methanization plants purpose-designed for energy recovery, such as farm biogas, co-digestion biogas and industrial biogas now produce almost three-quarters of the total biogas output leaving landfill sites and wastewater sludge treatment plants far behind.
Download in English
Download in other languages : ![]()
Baromètre biogaz 2017
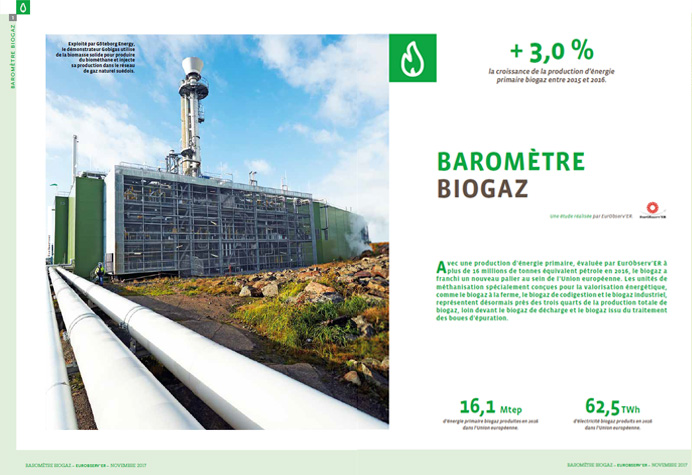 + 3,0 % la croissance de la production d’énergie primaire biogaz entre 2015 et 2016.
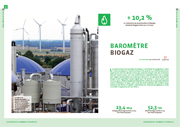
Avec une production d’énergie primaire, évaluée par EurObserv’ER à plus de 16 millions de tonnes équivalent pétrole en 2016, le biogaz a franchi un nouveau palier au sein de l’Union européenne. Les unités de méthanisation spécialement conçues pour la valorisation énergétique, comme le biogaz à la ferme, le biogaz de codigestion et le biogaz industriel, représentent désormais près des trois quarts de la production totale de biogaz, loin devant le biogaz de décharge et le biogaz issu du traitement des boues d’épuration.
Solar thermal and concentrated solar power barometer 2017
 – 4.6% The decrease of the solar thermal market in the European Union in 2016
The European solar thermal market is still losing pace. According to the preliminary estimates from EurObserv’ER, the solar thermal segment dedicated to heat production (domestic hot water, heating and heating networks) contracted by a further 4.6% in 2016 down to 2.6 million m2. The sector is pinning its hopes on the development of the collective solar segment that includes industrial solar heat and solar district heating to offset the under-performing individual home segment.
Download in English
Download in other languages : ![]()
![]()
Baromètres solaire thermique et solaire thermodynamique 2017
 – 4,6 % la baisse du marché solaire thermique de l’Union européenne en 2016
Le marché européen du solaire thermique continue sa lente décélération. Selon les premières estimations d’EurObserv’ER, le marché du solaire thermique dédié à la production de chaleur (eau chaude sanitaire, chauffage et réseau de chaleur) s’est de nouveau contracté de 4,6 % en 2016, pour atteindre 2,6 millions de m2. Pour pallier la baisse d’intensité du marché des maisons individuelles, le développement du marché du solaire collectif, de la chaleur solaire industrielle et des réseaux de chaleur solaire reste très attendu par la filière.
Solar thermie und Concentrated solar power Barometer 2017
 – 4,6% Rückgang des Solarthermiemarktes in der Europäischen Union 2016
Der europäische Solarthermiemarkt ist weiter auf dem Rückgang. Nach vorläufigen Schätzungen des EurObserv’ER hat sich das Solarthermie- Segment zur Wärmeproduktion (Warmwasser, Heizung und Wärmenetze) 2016 um weitere 4,6 % verringert und steht nun bei 2,6 Millionen m2. Die Branche hofft daher, dass es über die Entwicklung des Solarmarktes im Bereich der Kollektivanlagen, der solaren Industriewärme und der solaren Fernwärme gelingt, das schwache Einfamilienhaussegment auszugleichen.
Biokraftstoff barometer 2017
 +1,3 % Anstieg des Biokraftstoffverbrauchs im Verkehrssektor der Europäischen Union zwischen 2015 und 2016 (nach Energiegehalt)
Der Biokraftstoffverbrauch im Verkehrssektor hat 2016 leicht zugenommen. Vorläufigen Schätzungen des EurObserv’ER zufolge lag er bei 14,4 Mio. Tonnen Öläquivalent, was einem Anstieg von 1,3 % im Jahresvergleich entspricht. Dieser Anstieg lässt sich sämtlich auf den Biodieselverbrauch zurückführen, der um 2,4 % auf 11,6 Mio. Tonnen Öläquivalent gestiegen ist, während der Bioethanol-Verbrauch um 3,1 % auf 2,6 Mio. Tonnen Öläquivalent gefallen ist.
Biofuels barometer 2017
 +1.3 % The increase of biofuels consumption for transport in the European Union between 2015 and 2016 (in energy content)
Biofuel consumption for transport increased slightly in 2016. EurObserv’ER’s preliminary estimates suggest the figure of 14.4 million toe, which equates to 1.3% year-on-year growth. This increase was entirely driven by biodiesel consumption (which rose 2.4% to 11.6 Mtoe), as bioethanol consumption slipped (by 3.1% to 2.6 Mtoe).
Download in English
Download in other languages : ![]()
![]()
Baromètre biocarburants 2017
 + 1,3 % la hausse de la consommation de biocarburants dans les transports de l’Union européenne, entre 2015 et 2016 (en contenu énergétique)
La consommation de biocarburants à destination des transports a légèrement augmenté en 2016. Selon les premières estimations d’EurObserv’ER, elle devrait atteindre 14,4 millions de tep, soit une croissance de 1,3 % par rapport à 2015. Cette croissance s’explique uniquement par une augmentation de la consommation de biodiesel (+2,4 % à 11,6 Mtep), la consommation de bioéthanol ayant légèrement diminué (-3,1 % à 2,6 Mtep).
Photovoltaik Barometer 2017
 100 935 MWp in der Europäischen Union Ende 2016
Der globale Solarenergiemarkt entwickelt sich rasant – angetrieben von der enormen Nachfrage auf den asiatischen und amerikanischen Märkten. 2016 knackte der globale Photovoltaik-Markt die 76-GW-Marke und erreichte einen maximalen Zuwachs von 50 %. Der europäische Markt hingegen scheint sich festgefahren zu haben. Die dort zugebaute Leistung betrug 2016 lediglich 6,1 GW und lag damit unter den 7,9 GW des Vorjahres. Um den Marktanteil von Strom aus erneuerbaren Quellen in Zukunft zu vergrößern, werden die gesetzlichen Rahmenbedingungen des Sektors derzeit überarbeitet.
État des énergies renouvelables en Europe
 Depuis dix-sept ans, EurObserv’ER collecte des données sur les sources d’énergies renouvelables de l’Union européenne afin de décrire, dans des baromètres thématiques, l’état et la dynamique des filières. La première partie de cet ouvrage constitue une synthèse des baromètres diffusés en 2016 pour les filières éolienne, photovoltaïque, solaire thermique, pompes à chaleur, biocarburants et biomasse solide. Les données issues des ces baromètres ont été consolidées et complétées avec les données portant sur les filières non couvertes par des baromètres thématiques : la petite hydraulique, le biogaz, l’énergie géothermique, le solaire thermodynamique, l’incinération des ordures ménagères et les énergies marines renouvelables.
Ce dossier offre donc un tour d’horizon complet de la dimension énergétique des douze filières renouvelables développées, aujourd’hui, à une échelle industrielle au sein de l’Union européenne.
Wind energy barometer 2017
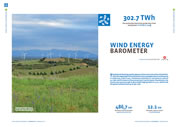 302.7 TWh The estimated electricity production from wind power in the EU in 2016
The global wind energy market appears to have encountered its initial limits. Since the beginning of the millennium it has expanded almost continuously to achieve 64.4 GW in 2015. Preliminary estimates for 2016 point to sales of 54.2 GW, which is down on the previous year’s performance. Nonetheless, the results were good enough to give double digit growth of 12.4%, which took the global installed base up to 486.7 GW.
Download in English
Download in other languages : ![]()
![]()
Baromètre éolien 2017
302.7 TWh La production d’électricité éolienne estimée dans l’Union européenne en 2016
Le marché mondial de l’éolien semble avoir trouvé ses premières limites. Après avoir augmenté de manière quasi continue depuis le début des années 2000 pour atteindre 64,4 GW en 2015, les premières estimations font état pour 2016 d’un marché annuel de 54,2 GW, en recul par rapport au marché de l’année précédente. Ces résultats permettent cependant au parc éolien mondial d’augmenter de 12,4 % pour s’établir désormais à 486,7 GW.
Windenergie Barometer 2017
Geschätzte Stromerzeugung aus Windenergie in der EU im Jahr 2016
Der globale Windenergie-Markt stößt offenbar erstmals an seine Grenzen. Seit Beginn des Jahrtausends war er beinah ununterbrochen gewachsen und erreichte im Jahr 2015 einen Wert von 64,4 GW. Vorläufige Schätzungen gehen für 2016 von Absatzzahlen in Höhe von 54,2 GW aus, was gegenüber den Ergebnissen des Vorjahres ein Rückgang ist. Dennoch schnitt der Markt mit einem zweistelligen Wachstumsergebnis von 12,4 % ab, sodass der Bestand der installierten Anlagen nunmehr auf 486,7 GW angewachsen ist.
Photovoltaic barometer 2017
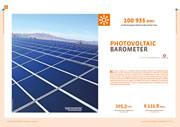 100 935 MWp in the European Union at the end of 2016
Not just a wave, it’s a breaker that has made landfall on the global solar power market, driven by strong Asian and American demand. The global solar photovoltaic market surged past the 76 GW mark in 2016, with peak growth at 50%. The European market seems to have drifted into slack water. It connected only 6.1 GW of additional capacity in 2016 and in doing so slipped below the previous year’s figure of 7.9 GW. The sector’s regulatory framework is being overhauled with a view to integrating more renewably-sourced electricity into the market.
Download in English
Download in other languages : ![]()
![]()
Baromètre photovoltaïque 2017
100 935 MWc dans l’Union européenne fin 2016
Plus qu’une vague, c’est une déferlante qui s’est abattue sur le marché mondial de l’électricité solaire, poussée par une forte demande des marchés asiatiques et américains. Le marché mondial du solaire photovoltaïque aurait dépassé les 76 GW en 2016, soit un pic de croissance de 50 %. Le marché européen obéit à une dynamique différente, seuls 6,1 GW supplémentaires ont été raccordés en 2016, soit une contraction par rapport aux 7,9 GW de 2015. Le secteur fait actuellement face à une réorganisation de son cadre réglementaire visant à intégrer davantage les énergies renouvelables électriques au marché.
Next RES barometers to be released in 2017
- April 2017 : Photovoltaic barometer
- June 2017 : Solar thermal and CSP barometer
- July 2017 : Biofuels barometer
- October 2017 : Biogaz barometer
- December 2017 : Solid biomass barometer
Wind energy barometer 2016
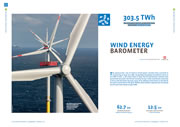 303.5 TWh The estimated electric production from wind power in the EU in 2015
The spectacular rise of China’s wind power market that resulted in connecting at least 30.5 GW, catapulted the global installation level to 62.7 GW in 2015– a 22% more than in 2014! The US and German markets also performed very well, the former because its tax credit mechanism remained in force and the latter because many of its offshore wind farms in the North Sea were connected to the grid. Global wind turbine capacity has increased by 17% and now stands at 432.6 GW.
Download in English
Download in other languages : ![]()
![]()
![]()
Baromètre éolien 2016
303.5 TWh La production d’électricité éolienne estimée dans l’Union européenne en 2015
La formidable ascension du marché éolien chinois, qui a vu le raccordement d’au moins 30,5 GW, a propulsé le niveau mondial d’installation à 62,7 GW en 2015, soit 22 % de plus qu’en 2014 ! Les marchés américain et allemand ont également affiché de belles performances, le premier du fait du maintien de son crédit d’impôt, le second grâce au raccordement de nombreuses fermes offshore en mer du Nord. La puissance éolienne mondiale s’établit désormais à 432,6 GW, soit une croissance du parc mondial de l’ordre de 17 %.
Windenergie Barometer 2016
303.5 TWh Geschätzte Stromerzeugung aus Windenergie in der EU in 2015
Der spektakuläre Aufstieg des chinesischen Windenergiemarktes, in dessen Folge mindestens 30,5 GW angeschlossen wurden, hat das Installationsniveau im Jahr 2015 weltweit auf 62,7 GW hochschnellen lassen – ein Zuwachs von 22 % gegenüber 2014! Der US-amerikanische und deutsche Markt schnitten sehr gut ab – zum einen, weil der für den amerikanischen Markt geltende Steuergutschrift-Mechanismus auch weiterhin in Kraft ist, und zum anderen, weil viele deutsche Offshore-Windparks in der Nordsee an das Netz angeschlossen wurden. Die globale Leistung von Windkraftanlagen hat sich um 17 % erhöht und beträgt jetzt 432,6 GW.
Energetyka Wiatrowa Biuletyn Energetyki Odnawialnej 2016
303.5 TWh Szacowana produkcja energii elektrycznej z farm wiatrowych w UE w 2015 r.
Spektakularny wzrost chińskiego rynku energii wiatrowej, kiedy zainstalowano co najmniej 30,5 GW, a globalny poziom instalacyjny wzrósł do 62,7 GW w 2015 r. – o 22 % więcej niż w 2014 roku! Rynki amerykańskie i niemieckie również bardzo dobrze dały sobie radę, ten pierwszy z powodu ulgi podatkowej, a drugi, ponieważ wiele z jego morskich farm wiatrowych na Morzu Północnym zostało przyłączonych do sieci. Globalne moce turbin wiatrowych wzrosły o 17% i wynoszą obecnie 432,6 GW.
Photovoltaic barometer 2016
 94,568 MWp in the European Union at the end of 2015
The European Union solar photovoltaic market picked up in 2015 after three successive years of decline. It registered 3% growth over the twelve-month period, by installing 7 226 MW, which took Europe’s installed capacity to date to 94.6 GW. The global market soared by comparison, gaining 25% year-on-year and connecting at least 50 GW, which took global PV capacity past the 227-GW mark.
Download in English
Download in other languages : ![]()
Baromètre photovoltaïque 2016
94,568 MWc dans l’Union européenne fin 2015
En 2015, le marché du solaire photovoltaïque de l’Union européenne est reparti à la hausse, après trois années consécutives de baisse. 7 226 MW ont été installés dans l’année, soit une croissance de 3 %, portant la puissance cumulée du parc européen à 94,6 GW. Quant au marché mondial, il a atteint des sommets : au moins 50 GW connectés en 2015, soit une croissance de 25 % par rapport à 2014. Fin 2015, la puissance photovoltaïque mondiale dépassait les 227 GW.
Solar thermal and concentrated solar power barometer 2016
 – 8.6% The decrease of the solar thermal market in the European Union in 2015
In 2015, the European Union saw its solar thermal market contract for the seventh year in a row. EurObserv’ER puts sales of solar thermal capacity installed for the heating market (hot water and space heating) at 1 861 MWth, equivalent to a 2.7 million m² of collectors… a further 8.6% decrease on the previous year’s poor performance. Combined solar thermal capacity installed to date in the EU stands at 34.3 GWth, or 49 million m² of collectors.
Download in English
Download in other languages : ![]()
Baromètres solaire thermique et solaire thermodynamique 2016
– 8.6% la baisse du marché solaire thermique de l’Union européenne en 2015
En 2015, le marché solaire thermique de l’Union européenne est en baisse pour la septième année consécutive. Selon EurObserv’ER, la puissance additionnelle des installations solaires thermiques dédiées au marché de la chaleur (eau chaude et chauffage) a atteint 1 861 MWth, soit une surface de capteurs de 2,7 millions de m². Cela représente une décroissance de 8,6 % par rapport aux capteurs installés l’an passé. La puissance cumulée des installations solaires thermiques atteint désormais 34,3 GWth, soit 49 millions de m² de capteurs.
Biofuels barometer 2016
 – 1.7% The decrease of biofuels consumption for transport in the European Union between 2014 and 2015 (in energy content)
The European biofuel market is now regulated by the directive, known as ILUC, whose wording focuses on the environmental impact of firstgeneration biofuel development. This long-awaited clarification has arrived against the backdrop of falling oil prices and shrinking European Union biofuel consumption, which should drop by 1.7% between 2014 and 2015, according to EurObserv’ER.
Download in English
Download in other languages : ![]()
Baromètre biocarburants 2016
– 1,7% La baisse de la consommation de biocarburants dans les transports de l’Union européenne entre 2014 et 2015 (en contenu énergétique)
Le marché européen des biocarburants est désormais régi par la directive, dite CASI, texte qui prend davantage en considération l’impact environnemental du développement des biocarburants de première génération. Cette clarification intervient dans un contexte de chute du prix du pétrole et de légère diminution de la consommation des biocarburants de l’Union européenne, laquelle devrait baisser selon EurOberv’ER de 1,7 % entre 2014 et 2015.
Heat pumps barometer 2016
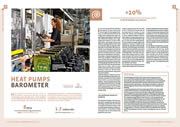
 +20% : the increase of the heat pump market in the EU between 2014 and 2015
The heat pump (HP) sector had an excellent year in 2015. Appliance sales taking all heating and cooling market technologies into account, increased by 20% from 2 212 898 units in 2014 to 2 655 331 units in 2015. The emerging trend over the past few years specific to the HP segment for water-borne systems is that air-source HPs are clearly gaining market shares to the detriment of the ground-source HP market, while reversible HPs using air as their vector are taking advantage of record temperatures that have given a boost to the cooling market.
Download in English
Download in other languages : ![]()
![]()
Baromètre pompes à chaleur 2016
+20% : la hausse du marché des PAC dans l’UE entre 2014 et 2015
L’année 2015 a été une très bonne année pour la filière des pompes à chaleur (PAC). En prenant en compte toutes les technologies présentes sur le marché du chauffage et du rafraîchissement, les ventes d’appareils ont augmenté de 20 % pour passer de 2 212 898 unités en 2014 à 2 655 331 unités en 2015. Sur le segment spécifique des PAC sur vecteur eau, une tendance se dégage depuis plusieurs années : la montée en puissance des PAC aérothermiques et la baisse du marché des PAC géothermiques. Les PAC réversibles sur vecteur air profitent quant à elles des records de températures qui ont boosté le marché du rafraîchissement.
Wärmepumpen Barometer 2016
+20% : Wachstum des EU-Wärmepumpenmarkts
zwischen 2014 und 2015
Für den Wärmepumpensektor (WP) war 2015 ein ausgezeichnetes Jahr. Unter Berücksichtigung sämtlicher Heiz- und Kühltechnologien stiegen die Anlagen-Verkaufszahlen von 2 212 898 Einheiten im Jahr 2014 um 20 % auf 2 655 331 Einheiten in 2015. Der aufkommende Trend der letzten Jahre im WP-Segment der wassergeführten Systeme zeigt, dass Luft-Wärmepumpen deutlich an Marktanteilen gewinnen konnten, zu Lasten des Erdwärmepumpen-Marktes, während reversible Luft-Wärmepumpen von Rekordtemperaturen profitierten, die zu einem Schub auf dem Kühlungsmarkt geführt haben.
EurObserv’ER Bridging Report
 Bridging the gap between member states’ progress reports of 2013 and 2015
Access to early information on RES growth in the EU 28 country members is the core aim of the EurObserv’ER barometers since their creation in 1999. Nowadays, among the indicators and information available and useful on the RES topic, the evolution of their share in gross final energy consumption is relevant for stakeholders, policymakers, industrialists, journalists or even simple European citizens.
On line with legal requirements under Directive 2009/28/EC on the promotion of the use of energy from renewable sources (known as the Renewable Energy Directive (RED)) (6), the European Commission (EC) formally assesses the EU’s and Member States’ progress in the promotion and use of renewable energy towards the 2020 RES targets. The EC publishes its assessments every two years, in the form of a Communication on ‘Renewable energy progress report’.
Disseminated in 2015, the purpose of this report is to present the detailed 2013 situation of RES shares at EU and Member State level during a year scheduled without any country progress report.
Solid biomass barometer 2016
 + 6.7% the growth of electricity from solid biomass in the UE between 2014 and 2015
Solid biomass consumption, primarily wood energy, is still largely governed by heating requirements which are climate-dependent. The main factor for the European rebound in solid biomass consumption as primary energy during the winter of 2015 is that it was not as mild across the continent as the previous winter. Leaving aside climatic variations, the use of solid biomass for producing heat or electricity has tended to increase in the European Union, spurred on by European support policies. A new consumption record of 93.8 Mtoe was posted in 2015… a rise of 3.8 Mtoe over 2014.
Download in English
Download in other languages : ![]()
![]()
Baromètre biomasse solide 2016
+ 6.7% L’augmentation de l’électricité issue de la biomasse solide dans l’UE entre 2014 et 2015
La consommation de biomasse solide, essentiellement du bois-énergie, reste encore fortement tributaire des besoins en chauffage et donc des conditions climatiques. L’hiver 2015 moins doux à l’échelle européenne que celui de 2014 explique en grande partie le rebond de la consommation d’énergie primaire biomasse solide. Indépendamment des aléas climatiques, l’utilisation de biomasse solide, que ce soit à des fins de production de chaleur ou de production d’électricité, tend à augmenter dans l’Union européenne sous l’impulsion de politiques européennes favorables. Elle affiche en 2015 un nouveau record de consommation avec 93,8 Mtep, soit une hausse de 3,8 Mtep par rapport à 2014.
Barometer für feste Biomasse 2016
+ 6.7% Wachstum der Primärenergieerzeugung aus fester Biomasse in der EU zwischen 2014 und 2015
Der Verbrauch fester Biomasse, überwiegend aus Holz, wird noch immer großenteils durch den Wärmebedarf bestimmt, der seinerseits von den klimatischen Bedingungen abhängt. In Europa stieg der Verbrauch fester Biomasse als Primärenergie im Winter 2015 vor allem deshalb wieder an, weil dieser Winter auf den gesamten Kontinent bezogen nicht ganz so mild ausfiel wie der vorangegangene. Lässt man die klimatischen Schwankungen beiseite, so nahm die Nutzung von Biomasse zur Erzeugung von Wärme und Strom in der Europäischen Union, hauptsächlich aufgrund der europäischen Fördermaßnahmen, tendenziell zu. 2015 wurde ein neuer Verbrauchsrekord von 93,8 Mio. Tonnen Öläquivalent verbucht – gegenüber 2014 ein Anstieg von 3,8 Mio. Tonnen.
16th annual overview barometer
 EurObserv’ER has been gathering data on the European Union’s renewable energy sources for seventeen years for its themebased barometer reports on the state of the sectors and their momentum. The first part of this work is a summary of the barometers published in 2016 for the wind energy, solar photovoltaic, solar thermal, heat pump, biofuel and solid biomass sectors. The data drawn from these barometers has been updated and supplemented by data on the sectors for which no individual barometers were published – small hydropower, biogas, geothermal energy, concentrated solar power, household refuse incineration and renewable marine energy sources.
Hence this publication offers a comprehensive energy dimension review of the twelve renewable sectors that are now developed in the European Union on an industrial scale. It also gives for the first time a view of the share of RES heating and cooling in the building stock.
Download in English
Download in other languages : ![]()
Methodology papers related to the 16th annual barometer
Main findings of the 16th overview barometer
Wind energy barometer 2015
 10.1% The growth of the total wind power capacity in the EU in 2014
The 2014 global wind energy market surged and set a new record after the previous year’s slowdown. More than 52 GW of capacity was installed across the world compared to a little less than 37 GW in 2013. Global wind energy took a 41.4% leap in 2014 to culminate in more than 371 GW of installed capacity.
Download in English
Download in other languages : ![]()
![]()
![]()
![]()
Baromètre éolien 2015
+ 10,1 % La croissance du parc éolien de l’UE en 2014.
Après avoir ralenti en 2013, le marché mondial de l’éolien est reparti à la hausse pour établir un nouveau record d’installation. Plus de 52 GW éoliens ont été installés dans le monde en 2014, contre une puissance d’un peu moins de 37 GW en 2013. Le marché a donc fait un bond de 41,4 % l’an dernier, portant la puissance mondiale cumulée à plus de 371 GW.
Windenergie Barometer 2015
10,1 % Erzeugungsleistung von Windenergie in der the EU in 2014
Der weltweite Windenergiemarkt wuchs 2014 rasant und stellte einen neuen Installationsrekord auf. Mehr als 52 GW Leistung wurden auf der ganzen Welt installiert, im Vergleich zu knapp 37 GW im Jahr 2013. Die weltweite installierte Windenergieleistung stieg 2014 um 41,4% auf mehr als 371 GW an.
Biuletyn energii odnawialnej – energetyka wiatrowa 2015
 10,1% Wzrost mocy zainstalowanych w UE w 2014 roku.
W 2014 roku globalny rynek energii wiatrowej powrócił na ścieżkę wzrostu po wcześniejszym okresie spowolnienia w 2013 roku. Ponad 52 GW mocy zostało zainstalowanych na całym świecie, nieco więcej niż w 2013 roku (37 GW). Dynamika wzrostu wyniosła 41,4% w 2014 roku osiągając w sumie 371 GW mocy zainstalowanej na świecie.
Energija Vjetra Barometar 2015
10,1 % rast instaliranih kapaciteta za proizvodnju električne energije iz energije vjetra u EU u 2014. godini
Nakon usporavanja u 2013. godini, globalno je tržište energije vjetra u 2014. godini dosegnulo novi rekord. Tijekom 2014. godine je diljem svijeta instalirano više od 52 GW novih kapaciteta što predstavlja skok za 41,4% u usporedbi s 2013. godinom tijekom koje je bilo instalirano nešto manje od 37 GW. Kumulativno gledano su kapacitete u vjetroelektranama instaliranim diljem svijeta tijekom 2014. godine preskočile razinu od 371 GW.
Photovoltaic barometer 2015
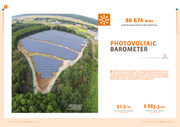 86 674 MWp in the European Union at the end of 2014
The global photovoltaic market continued to expand between 2013 and 2014, rising from 37.6 GW to almost 40 GW unlike the European Union market that plummeted further. The EurObserv’ER estimate of the European photovoltaic market is about 6.9 GWp in 2014, a 32.3 % drop on 2013, yet three years earlier, in 2011, it hovered around the 22 GWp mark.
Download in English
Download in other languages : ![]()
![]()
![]()
![]()
Baromètre photovoltaïque 2015
86 674 MWc dans l’Union européenne fin 2014
Alors que le marché mondial du photovoltaïque a continué de croître entre 2013 et 2014, passant de 37,6 GWc à près de 40 GWc, celui de l’Union européenne a, lui, poursuivi son décrochage. Selon EurObserv’ER, le marché du photovoltaïque en Europe devrait se situer aux alentours de 6,9 GWc en 2014, en baisse de 32,3 % par rapport à 2013. Trois ans plus tôt, en 2011, il s’établissait à près de 22 GWc…
Photovoltaik Barometer 2015
 86 674 MWp in der Europäischen Union Ende 2014
Der globale PV-Markt ist zwischen 2013 und 2014 weiter gewachsen und stieg von 37,6 GW auf fast 40 GW – im Gegensatz zum EU-Markt, der weiter eingebrochen ist. Die Schätzung von EurObserv’ER für den europäischen Photovoltaik-Markt beläuft sich für 2014 auf 6,9 GWp, was gegenüber 2013 einen Rückgang von 32,3 % bedeutet, während der Markt sich noch drei Jahre zuvor bei rund 22 GWp eingependelt hatte.
Biuletyn energii odnawialnej fotovoltaika 2015
86 674 MWp moc zainstalowana w Unii Europejskiej w 2014 roku
Światowy rynek fotowoltaiczny po raz kolejny wzrósł w latach 2013-2014 z 37,6 GW do niemal 40 GW, w odróżnieniu od rynku Unii Europejskiej, który zanotował dalszy, silny spadek. Szacunki konsorcjum EurObserv’ER pozycjonują go na ok, 6,9 GWp w 2014 roku, co oznacza spadek o 32,3% w stosunku do roku 2013, podczas gdy trzy lata wcześniej, w 2011 roku, oscylował wokół progu 22 GWp.
Barometar Fotonapona 2015
86 674 MWp u Europskoj Uniji krajem 2014. godine
Globalno tržište fotonapona nastavilo se širiti tijekom 2013. i 2014. godine, povećavši se s 37,6 GW na gotovo 40 GW, za razliku od tržišta Europske Unije koje je dodatno potonulo. Procjena EurObserv’ER a za europsko tržište fotonapona je oko 6,9 GWp u 2014. godini što je pad od 32,3% u usporedbi s 2013. godinu, a tri godine ranije, 2011. godine vrtilo se oko 22 GWp.
Solar thermal and concentrated solar power barometer 2015
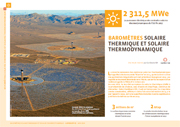
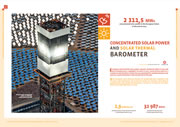 2 311,5 MWe The CSP plant generation capacity in the EU at the end of 2014
European concentrated solar power capacity remained stable in 2014 and will probably post a negligible increase in 2015. Construction work on a number of new facilities in Italy that are scheduled for commissioning in 2016 and 2017 could commence in the second half of the year. The European solar thermal market for producing heat, domestic hot water and heating has not found the recipe for recovery. According to EurObserv’ER , the market contracted by a further 3.7% from its 2013 level which is the sixth decrease in a row.
Download in English
Download in other languages : ![]()
![]()
![]()
![]()
Baromètres solaire thermique et solaire thermodynamique 2015
2 311,5 MWe La puissance électrique des centrales solaires thermodynamiques de l’UE fin 2014
La puissance européenne des centrales solaires thermodynamiques dont la vocation est de produire de l’électricité est restée stable en 2014 et ne devrait que très marginalement évoluer en 2015. La construction d’une série de nouveaux projets pourrait débuter au deuxième semestre 2015 sur le territoire italien, avec des mises en service prévues en 2016 et 2017. Le marché européen du solaire thermique dédié à la production de chaleur, eau chaude sanitaire et chauffage, n’a toujours pas trouvé la solution pour rebondir. Selon EurObserv’ER, il est une nouvelle fois en diminution, et ce pour la sixième année consécutive, avec une baisse de 3,7 % par rapport à 2013.
CSP und Solarthermie Barometer 2015
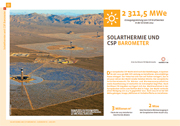
2 311,5 MWe : Installierte CSP Leistung in der
Europäischen Union Ende 2014
Die installierte CSP Leistung in der Europäischen Union ist 2014 gleich geblieben und wird 2015 vermutlich nur einen unbedeutenden Anstieg verbuchen. Die Arbeiten an mehreren neuen Anlagen, die in Italien 2016 und 2017 in Betrieb gehen sollen, könnten in der zweiten Hälfte des Jahres beginnen.
Der europäische Solarthermie-Markt zur Erzeugung von Wärme und Warmwasser für Haushalte hat bisher kein Patentrezept gefunden, um sich zu erholen. Nach Angaben des EurObserv’ER schrumpfte der Markt im Vergleich zu 2013 um weitere 3,7 % und verzeichnet somit das sechste Jahr in Folge einen Rückgang.
Technologia skoncentrowanej energii słonecznej csp i kolektory słoneczne biuletyn energii odnawialnej 2015
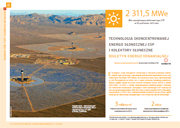
2 311,5 skoncentrowana energia słoneczna na koniec 2014 r. w Unii Europejskiej
Zainstalowana moc na europejskim rynku skoncentrowanej energii słonecznej pozostała stabilna w 2014 roku i prawdopodobnie zanotuje nieznaczny wzrost w 2015 roku. Prace budowlane przy kilku nowych obiektach we Włoszech, które mają być uruchomione w 2016 i 2017 roku, mogą rozpocząć się w drugiej połowie roku.
Europejski rynek kolektorów słonecznych do produkcji ciepła, ciepłej wody i ogrzewania nie znalazł sposobu na powrót do trendów wzrostowych. Według konsorcjum EurObserv’ER rynek zanotował spadek o kolejne 3,7% w porównaniu z poziomem z 2013 r., który jest szóstym rokiem spadku z rzędu.
Barometar Koncentrirane Solarne i Solarne Toplinske energije 2015
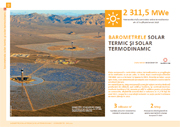
2 311,5 MWe koncentrirana solarna energija u Europskoj Uniji krajem 2014. g.
Europski kapacitet koncentrirane solarne energije ostao je stabilan 2014. g. i u 2015. g. će vjerojatno zabilježiti neznatan rast. Građevinski radovi na nekoliko novih postrojenja u Italiji za koje se planira puštanje u pogon 2016. i 2017. g. mogli bi započeti u drugoj polovici godine. Europsko solarno toplinsko tržište za proizvodnju topline, tople vode u domaćinstvima i grijanje još nije našlo recept za oporavak. Prema podacima EurObserv’ER -a, tržište se smanjilo za dodatnih 3,7% od razine u 2013. g., što je šesti uzastopni pad.
Biofuels barometer 2015
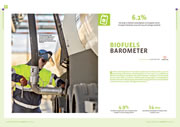 + 6.1% The increase of biofuel consumption in European Union transport between 2013 and 2014 (in energy content)
Biofuel consumption for transport picked up in Europe after a year of uncertainty and decline, increasing by 6.1% over 2013, to 14 million toe (Mtoe) according to EurObserv’ER ’s first estimates. However it is still below its 2012 level when 14.5 Mtoe of biofuel was incorporated. Consumption of biofuel that meets the European Renewable Energy directive’s sustainability criteria rose to 12.5 Mtoe, its highest level so far.
Download in English
Download in other languages : ![]()
![]()
![]()
![]()
Baromètre biocarburants 2015
+ 6,1 % l’augmentation de la consommation de biocarburants dans les transports de l’Union européenne entre 2013 et 2014 (en équivalent énergétique)
Après une année d’incertitudes et de baisse, la consommation de biocarburants à destination des transports est repartie à la hausse en Europe. Selon les premières estimations EurObserv’ER , elle aurait augmenté de 6,1 % par rapport à 2013, pour atteindre 14 millions de tep (Mtep), mais reste cependant en deçà du niveau observé en 2012, où 14,5 Mtep de biocarburants avaient été incorporées. La consommation de biocarburants respectant les critères de durabilité de la directive européenne Énergies renouvelables atteint, elle, son plus haut niveau, à 12,5 Mtep.
Biokraftstoff Barometer 2015
6,1% Anstieg des Biokraftstoffverbrauchs im Verkehrssektor der Europäischen Union zwischen 2013 und 2014 (nach Energiegehalt)
Der Biokraftstoffverbrauch im europäischen Verkehrssektor hat sich nach einem Jahr der Unsicherheit und des Rückgangs wieder erholt und ist nach ersten Schätzungen von EurObserv’ER gegenüber 2013 um 6,1 % auf 14 Mio. Tonnen Öläquivalent gestiegen. Damit liegt er jedoch weiterhin unter dem Biokraftstoff-Beimischungsniveau von 2012 mit seinerzeit 14,5 Mio. Tonnen Öläquivalent. Der Verbrauch von Biokraftstoff, der die Nachhaltigkeitskriterien der Europäischen Richtlinie für Erneuerbare Energien erfüllt, stieg auf 12,5 Mio. Tonnen Öläquivalent an und erreicht damit sein bisher höchstes Niveau.
Biuletyn energii odnawialnej biopaliwa transportowe 2015
+ 6.1% spadek zużycia biopaliw w transporcie w Unii Europejskiej w latach 2013 i 2014 (wyrażonae jako wartość energetyczna)
Zużycie biopaliw w europejskim transporcie wzrosło o 6,1%, po roku niepewności i spadku w stosunku do 2013 roku, do 14 mln toe (Mtoe) według pierwszych szacunków konsorcjum EurObserv’ER. Jednak jest to wciąż poniżej poziomu z 2012 roku, gdy 14,5 Mtoe biopaliw zostało wprowadzone na rynek. Zużycie biopaliw, które spełniają kryteria zrównoważonego rozwoju europejskiej dyrektywy energii odnawialnej wzrosło do 12,5 Mtoe, najwyższego do tej pory poziomu.
Barometar Biogoriva 2015
+ 6,1 % porast u potrošnji biogoriva za potrebe prijevoza u Europskoj Uniji između 2013. i 2014. g.
Potrošnja biogoriva za prijevoz porasla je nakon godine nesigurnosti i pada, tako što je porasla za 6,1% tijekom 2013. g. na 14 milijuna tona (Mtoe) prema prvim procjenama EurObserv’ER -a. Međutim, još uvijek je ispod razine iz 2012. g. kad je bilo uključeno 14,5 Mtoe biogoriva. Potrošnja biogoriva koje zadovoljava kriterije održivosti Direktive o promicanju uporabe energije iz obnovljivih izvora popela se na 12,5%, na najvišu razinu ikad postignutu.
Heat pumps barometer 2015
 10% the increase of the aerothermal air/air heat pump market in the EU between 2013 and 2014
Heat pumps have moved up the ranks of renewable energy-producing heating technologies since the mid-2000s. The EU Member States’ individual market trends are characterised by the technologies used and their heating and cooling needs. More than 1.7 million systems were sold in the European Union in 2014. According to EurObserv’ER, several market factors were responsible for sales dipping slightly below their 2013 level of just under 2 million.
Download in English
Download in other languages : ![]()
![]()
![]()
![]()
Baromètre pompes à chaleur 2015
10% la hausse du marché des PAC aérothermiques air/eau dans l’UE entre 2013 et 2014
Depuis le milieu des années 2000, les pompes à chaleur ont gagné leur place parmi les technologies de chauffage produisant de l’énergie renouvelable. Sur l’évolution du marché, il existe au sein des pays de l’Union européenne des tendances particulières, fonction des technologies, mais également fonction des besoins de chauffage et de rafraîchissement. Selon EurObserv’ER , plus de 1,7 million de systèmes ont été vendus dans l’Union européenne en 2014, contre un peu moins de 2 millions en 2013. Cette baisse doit cependant être interprétée au regard de la dynamique de plusieurs marchés.
Wärmepumpen Barometer 2015
+10% Zuwachs des Marktes für aerothermische Luft-Luft-Wärmepumpen in der EU zwischen 2013 und 2014.
Wärmepumpen haben sich seit Mitte der 2000er Jahre als Heiztechnologie zur Erzeugung von Energie aus erneuerbaren Quellen fest etabliert. Die Markttrends der einzelnen EU -Mitgliedsstaaten ergeben sich aus den verwendeten Technologien und dem jeweiligen Heiz- und Kühlbedarf. Über 1,7 Millionen Anlagen wurden laut EurObserv’ER im Jahr 2014 in der Europäischen Union verkauft. Für den leichten Rückgang der Verkaufszahlen gegenüber der Marke von 2013, die bei knapp unter 2 Millionen lag, sind mehrere Marktfaktoren verantwortlich.
Biuletyn energii odnawialnej – pompy ciepła 2015
10% wzrost sprzedaży powietrznych pomp ciepła powietrze/powietrze w UE pomiędzy 2013 a 2014 r.
Rynek pomp ciepła rozwija się wśród technologii grzewczych wytwarzających energię ze źródeł odnawialnych od ok 2005 roku. Poszczególne tendencje na rynku w państwach UE charakte ryzują różne technologie oraz potrzeby ogrzewnictwa i chłodnictwa. Ponad 1,7 mln systemów zostało sprzedanych w Unii Europejskiej w roku 2014. Zgodnie z EurObserv’ER, kilka czynników rynkowych było odpowiedzialnych za sprzedaż spadając nieznacznie poniżej poziomu z 2013 r. do niespełna 2 mlns ztuk.
Toplinske Pumpe Barometar 2015
10% povećanje tržišta zračnih pumpi zrak/zrak u EU između 2013. i 2014. g.
Od polovice prošlog deset l jeć a topl inske pumpe (HP) bi lježe stalan rast na ljestvici zastupljenosti među tehnologijama proizvodnje toplote iz obnovljivih izvora energije. Tržišne trendove pojedinih država članica EU dirigira njihova potreba za grijanjem i hlađenjem te tehnologije koje su im najdostupnije. Više od 1 ,7 mi l ijuna sustava toplinskih pumpi je prodano u Europskoj Uniji 2014. g. Prema podacima EurObserv’ER-a, nekol iko je tržišnih faktora odgovorno za pad prodaje na razinu koja je nešto ispod vrijednosti iz 2013. g.(prodano skoro 2 milijuna sustava).
Solid biomass barometer 2015
 + 4.5% the growth of electricity from solid biomass in the UE between 2013 and 2014
The European Reanalysis and Observations for Monitoring (EURO4M) project experts report that the year 2014 was unusually hot on the European continent, with the highest temperatures on record, following on from 2013 whose winter conditions were also exceptionally mild, and ahead of 2015 which is also set to be very warm. This situation led to a fall in solid biomass consumption for heating across the European Union. In 2014 electricity output increased by 4.5% on its 2013 level to 84.8 TWh, as the vagaries of climate have less impact on demand and it was also boosted by the expansion of biomass cogeneration and new coal-fired power plant conversions.
Download in English
Download in other languages : ![]()
![]()
![]()
Baromètre biomasse solide 2015
+ 4,5 % L’augmentation de l’électricité issue de la biomasse solide dans l’UE entre 2013 et 2014
L’année 2014 a été particulièrement chaude sur le continent européen, avec les températures les plus hautes jamais enregistrées, selon les experts européens de l’European Reanalysis Observations for Monitoring (EUR04M). Elle suit une année 2013 où les conditions hivernales avaient également été particulièrement clémentes et devance une année 2015 également annoncée comme très chaude. Cette situation a eu comme conséquence à l’échelle de l’Union européenne une diminution de la consommation de biomasse solide destinée aux besoins de chaleur. La production d’électricité, moins dépendante des aléas climatiques, augmente de 4,5 % par rapport à 2013 et atteint 84,8 TWh en 2014. Elle profite du développement de la cogénération biomasse et de la conversion de nouvelles centrales charbon.
Barometer für feste Biomasse 2015
+ 4.5% Wachstum der Primärenergieerzeugung aus fester Biomasse in der EU zwischen 2013 und 2014
Das Jahr 2014 war laut Experten des EURO4M-Projekts (European Reanalysis and Observations for Monitoring) auf dem europäischen Kontinent ungewöhnlich warm und brachte die bisher höchsten Temperaturen seit Beginn der Wetteraufzeichnungen. Bereits 2013 wurde ein außergewöhnlich milder Winter registriert, und auch 2015 entwickelte sich zu einem sehr warmen Jahr. Dadurch kam es in der gesamten Europäischen Union zu einem Verbrauchsrückgang von fester Biomasse im Heizungsbereich. Die Stromerzeugung hingegen stieg 2014 gegenüber 2013 um 4,5 % auf 84,8 TWh an, da sich einerseits die klimatischen Schwankungen weniger stark auf die Nachfrage auswirken und andererseits der Ausbau von Biomassekraftwerken mit Kraft-Wärme-Kopplung sowie neu umgebaute Kohlekraftwerke zu einem Verbrauchsanstieg geführt haben.
Biuletyn energii odnawialnej – biomasy stałej 2015
+ 4.5% wzrost energii elektrycznej z biomasy stałej w UE w latach 2013 i 2014
Eksperci projektu „Europejskie Analizy i Spostrzeżenia Dotyczące Monitoringu” (EURO4M) zauważyli, że rok 2014 był niezwykle gorący na kontynencie europejskim, z rekordowymi temperaturami, po 2013 roku, którego zima była również wyjątkowo łagodna, a przed 2015 r., który był także bardzo ciepły. Sytuacja ta doprowadziła do spadku zużycia biomasy stałej w ogrzewnictwie w całej Unii Europejskiej. W 2014 roku produkcja energii elektrycznej wzrosła o 4,5% w stosunku do poziomu z 2013 roku (84,8 TWh), a kaprysy klimatu mają mniejszy wpływ na popyt i została również zmieniona przez ekspansję kogeneracji biomasy i konwersję nowych elektrowni węglowych.
15th annual overview barometer
 For sixteen years now, EurObserv’ER has been collecting data on European Union renewable energy sources to describe the state and thrust of the various sectors in its focus studies or barometers. The first part of this assessment is an updated and completed summary of the work published in 2015 in Systèmes Solaires (Journal de l’Éolien n° 16, Journal du Photovoltaïque n° 13 and Journal des Énergies Renouvelables n° 227, 228 and 229).
This publication provides a complete overview of the twelve renewable sectors. Their performances are compared against the sta-ted goals set out by each country in its National Renewable Energy Action Plan (NREAP). Additionally, for the sixth year running, the EurObserv’ER consortium members have published their annual renewable energy share estimates of overall final energy consumption for each Member State of the European Union. These figures provide preliminary indication of how the various countries are faring along their renewable energy paths and whether their individual trends point to successful achievement of the targets set by European Directive 2009/28/EC.
Download in English
Download in other languages : ![]()
15e baromètre bilan
Depuis seize ans, EurObserv’ER collecte des données sur les sources d’énergies renouvelables de l’Union européenne afin de décrire, dans des baromètres thématiques, l’état et la dynamique des filières. La première partie de cet ouvrage constitue une synthèse des travaux publiés en 2015 dans Systèmes Solaires (n° 16 du Journal de l’Éolien, n° 13 du Journal du Photovoltaïque et n° 227, 228 et 229 du Journal des Énergies Renouvelables), largement actualisée et complétée avec les données statistiques les plus récentes.
Ce dossier offre donc un tour d’horizon complet de dix filières renouvelables, complété par une note de synthèse sur les énergies marines et le solaire thermodynamique. Ces filières sont analysées à l’aide de différents indicateurs de type énergétique. Leurs performances sont comparées aux niveaux fixés par chaque pays dans son plan d’action national. De plus, pour la troisième année, les membres du consortium EurObserv’ER publient leur estimation annuelle de la part des énergies renouvelables dans la consommation brute d’énergie finale pour chaque pays de l’Union européenne. Ces estimations permettront de donner une première indication sur la trajectoire “énergie renouvelable” des différents pays et de vérifier en tendance s’ils sont en mesure d’atteindre leurs objectifs fixés par la Directive européenne 2009/28/CE.
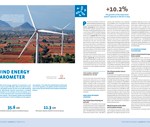
Wind energy barometer 2014
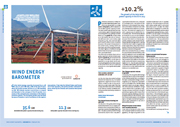 10.2 % The growth of the total wind power capacity in the EU in 2013
Global wind energy capacity increased by 12.4 % in 2013 to 318.6 GW (283.4 GW at the end of 2012), while the global market shrank to 35.6 GW shedding 10 GW. Worldwide market contraction is largely attributable to the collapse of the US market, as a result of the eleventh-hour extension of the federal incentive system. The European market also declined because of investors’ lack of confidence in the region’s new policies. If we take the United States and Europe out of the equation, the global market continued to grow, driven by the Chinese and Canadian wind power sectors.
Download in English
Download in other languages : ![]()
![]()
![]()
![]()
Baromètre éolien 2014
 + 10,2 % : La croissance du parc éolien de l’UE en 2013
La puissance mondiale de l’énergie éolienne a augmenté de 12,4 % en 2013 pour atteindre 318,6 GW (283,4 GW fin 2012). Le marché mondial est toutefois en net recul et perd 10 GW en 2013 pour atteindre 35,6 GW. La baisse du marché mondial est en grande partie attribuable à l’écroulement du marché des États-Unis, consécutif à une reconduction extrêmement tardive du système d’incitation fédéral. Le marché européen s’est également contracté en raison d’un manque de confiance des investisseurs dans les nouvelles politiques menées dans la région. En dehors des États- Unis et de l’Europe, le marché mondial a continué d’augmenter, poussé par les croissances chinoise et canadienne.
Windenergie Barometer 2014
 +10.2% Wachstum der Gesamt-Windenergiekapazität
in der EU 2013
Die globale Windenergiekapazität stieg 2013 um 12,4 % auf 318,6 GW (283,4 GW bis Ende 2012), der globale Markt schrumpfte dagegen um 10 GW auf 35,6 GW. Die Schrumpfung des Weltmarkts geht vor allem auf den Zusammenbruch des US-Markts infolge der erst in letzter Minute beschlossenen Verlängerung des Bundes-Vergütungssystems zurück. Der europäische Markt präsentierte sich ebenfalls schwächer, da es den Investoren an Vertrauen in die neue Politik der Region fehlte. Wenn wir die USA und Europa nicht berücksichtigen, wächst der Windenergie-Weltmarkt weiter, vor allem in China und Kanada.
Biuletyn energii odnawialnej – energetyka wiatrowa 2014
 +10.2% Wzrost mocy zainstalowanych w UE w 2013r
W 2013 roku moc zainstalowana w energetyce wiatrowej na świecie osiagnęła 318,6 GW. Mimo, że rynek nowo zainstalowanych mocy zwiększył się o 12% osiągając 35,5 GW, to w porównaniu z rokiem 2012 odnotowano spadek dynamiki przyrostu nowych mocy zainstalowanych. Znaczący wpływ na globalne spowolnienie tempa wzrostu nowych inwestycji, miało zahamowanie na rynku amerykańskim spowodowane opóźnionym rozszerzeniem federalnego systemu wsparcia. Również rynek europejski odnotował spadek tempa wzrostu wynikający z niepewności inwestorów odnośnie nowych przepisów w poszczególnych krajach członkowskich. Poza Stanami Zjednoczonymi i Europą, światowy rynek wzrastał, napędzany przez chiński i kanadyjski sektor energetyki wiatrowej.
Barometrul energei eoliene 2014
 10.2% Creşterea parcului eolian al UE în 2013
Capacitatea la nivel mondial a energiei eoliene a crescut cu 12,4 % în 2013 atingând 318,6 GW (283,4 GW la sfârşitul anului 2012). Piața globală este totuşi în regres evident, pierzând 10 GW în 2013 pentru a ajunge la 35,6 GW. Scăderea pieței mondiale poate fi atribuită în mare parte prăbuşirii pieței din Statele Unite în urma unei reînnoiri extrem de tardive a sistemului federal de bonificații. Piața europeană a intrat de asemenea în declin din cauza unei lipse de încredere a investitorilor față de noile politici promovate în regiune. În afara Statelor Unite şi a Europei, piața mondială a continuat să crească, impulsionată de creşterile înregistrate în China şi Canada.
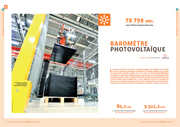
Photovoltaic barometer 2014
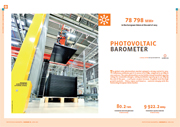 78 798 MWp in the European Union at the end of 2013
The global solar photovoltaic market enjoyed a strong revival in 2013. Preliminary estimates put it in excess of 37 GWp, compared to 30 GWp in 2012 and 2011. The solar photovoltaic sector led the annual installed capacity ratings for renewable energies, taking worldwide capacity up to 137 GWp by the end of the year … a 35% year-on-year increase. At global level the high growth markets – China, Japan and America – contrast sharply with the contracting European Union market.
Download in English
Download in other languages : ![]()
![]()
![]()
![]()
Baromètre photovoltaïque 2014
 78 798 MWc dans l’Union européenne fin 2013
Le marché mondial du solaire photovoltaïque s’est nettement relancé en 2013. Selon les premières estimations, il aurait dépassé les 37 GWc en 2013, contre environ 30 GWc en 2011 et 2012. Le solaire photovoltaïque devient donc la première filière énergie renouvelable au titre de la puissance annuelle installée. Celle-ci atteint désormais 137 GWc fin 2013 dans le monde, ce qui constitue une croissance de 35 % par rapport à l’année précédente. On observe un contraste saisissant entre la forte croissance des marchés chinois, japonais et américain et la baisse sensible du marché de l’Union européenne.
Photovoltaik Barometer 2014
 78 798 MWp in der Europäischen Union Ende 2013
Der globale Photovoltaik-Markt erholte sich 2013 deutlich. Nach vorläufigen Schätzungen beläuft sich der Zubau auf über 37 GWp, nach etwa 30 GWp in den Jahren 2012 und 2011. Der Photovoltaik-Sektor weist den größten Leistungszubau aller erneuerbarer Energietechnologien auf. Bis Ende des Jahres stieg die weltweit installierte Kapazität auf 137 GWp, was im Jahresvergleich einem Anstieg von 35 % entspricht. Auf globaler Ebene ist dennoch ein starker Kontrast zwischen den Märkten mit großem Wachstum – China, Japan und Amerika – und dem schrumpfenden Markt der Europäischen Union zu verzeichnen.
Biuletyn energii odnawialnej – fotowoltaika 2014
 78 798 MWp w Unii Europejskiej w 2013
W roku 2013 światowy rynek fotowoltaiki charakteryzował się silnym ożywieniem. Wstępnie szacuje się roczny przyrost mocy zainstalowanej na poziomie 37 GWp, w porównaniu do 30 GWp w 2012 i 2011 roku. Wyniki sektora fotowoltaicznego wpłynęły pozytywnie również na bilanse zielonej energii uwzględniające wszystkie odnawialne źródła energii. Całkowite moce zainstalowane PV na świecie osiągnęły pod koniec roku sumaryczną moc 137 GWp, z rocznym przyrostem rzędu 35%. W kontekście rynku światowego, dynamicznie rozwijające się rynki PV w Chinach, Japonii i Stanach Zjednoczonych wyraźnie kontrastują z kurczącym się rynkiem Unii Europejskiej.
Barometrul energiei fotovoltaice 2014
 78 798 MWp în UE la finele lui 2013
Piaţa mondială a energiei solare fotovoltaice s-a relansat puternic în 2013. Conform primelor estimări, aceasta ar fi depăşit 37 GWp în 2013, faţă de aproximativ 30 GWp în 2012 şi 2011. Sectorul energetic fotovoltaic devine aşadar primul domeniu energetic regenerabil din punct de vedere al puterii anuale instalate. Aceasta a ajuns deja la 137 GWp la sfârşitul anului 2013 la nivel mondial, ceea ce reprezintă o creştere de 35 % faţă de anul precedent. Se observă un contrast puternic între creşterea puternică a pieţelor din China, Japonia şi Statele Unite şi scăderea sensibilă a pieţei Uniunii Europene.
Solar thermal and concentrated solar power barometer 2014
 2 311,5 MWe The CSP plant generation capacity in the EU at the end of 2013
The European concentrated solar plant market is set to mark time for a year following efforts to complete construction on 350 MW of CSP capacity in Spain in 2013. The spotlight has switched to Italy which could re-launch the European market within a couple of years. The European solar thermal market for heat and hot water production and space heating, is shrinking all the time. EurObserv’ER reports that the market is in its fifth successive year of contraction in the European Union. It now posts a 10.5% decline on its 2012 performance having struggled to install just over 3 million m2 of collectors in 2013.
Download in English
Download in other languages : ![]()
![]()
![]()
![]()
Baromètres solaire thermique et solaire thermodynamique 2014
 2 311,5 MWe La puissance électrique des centrales solaires thermodynamiques de l’UE fin 2013
Le marché européen des centrales solaires thermodynamiques s’apprête à vivre une année “blanche” en 2014, après la construction des 350 derniers mégawatts qui s’est achevée en Espagne en 2013. Les regards se tournent désormais vers l’Italie, qui porte les espoirs d’un redémarrage de la filière d’ici à deux ans. De son côté, le marché européen du solaire thermique dédié à la production de chaleur, eau chaude et chauffage, continue de décrocher. Selon EurObserv’ER, il est en baisse pour la cinquième année consécutive, affichant cette fois une diminution de 13,2 % par rapport à 2012, soit une superficie installée à peine supérieure à 3 millions de mètres carrés en 2013.
Solarthermie und CSP Barometer 2014
 2 311,5 MWe Erzeugungsleistung von CSP-Kraftwerken in der EU Ende 2013
Der europäische CSP-Markt wird nach den Bemühungen, in Spanien im Jahr 2013 350 MW CSP-Leistung zu installieren, eine einjährige Pause einlegen. Der Fokus hat sich nun auf Italien verlagert, das in ein paar Jahren den Markt wieder beleben könnte. Der europäische Solarthermiemarkt für Wärme- und Warmwasserproduktion sowie Raumheizung ist weiterhin im Schrumpfen begriffen. Nach EurObserv’ER Angaben verringert sich das Marktwachstum in der Europäischen Union zum fünften Mal in Folge. Der Markt verbucht einen Rückgang von 10,5 % gegenüber 2012. Auch 2013 ist es nur mit Mühe gelungen, knapp 3 Millionen m2 Kollektorfläche zu installieren.
Technologia skoncentrowanej energii słonecznej csp i kolektory słoneczne biuletyn energii odnawialnej 2014
 2 311,5 MWe Moc zainstalowana elektrowni typu CSP w UE pod koniec 2013 roku
Europejski rynek energetyki słonecznej w zakresie produkcji ciepła, ciepłej wody użytkowej i ogrzewania pomieszczeń nieustannie kurczy się. Konsorcjum EurObserv’ER donosi, że roczne przyrosty mocy zainstalowanej w Unii Europejskiej już piąty rok z rzędu wykazują tendencję spadkową. Obecny spadek tempa przyrostu nowych instalacji wynosi 10,5% w latach 2012-2013. W 2013 r. zostało zainstalowanych zaledwie ponad 3 milionów m2 kolektorów słonecznych. Europejski rynek technologii CSP oczekuje od roku na zakończenie budowy 350 MW mocy w elektrowniach CSP w Hiszpanii, rozpoczętych w 2013 roku. Zainteresowanie przeniosło się do Włoch, gdzie oczekuje sie reaktywacji europejskiego rynku inwestycji dla tej technologii.
Barometrele solar termic şi solar termodinamic 2014
 2 311,5 MWe Puterea electrică a centralelor solare termodinamice ale UE la sfârşitul anului 2013
Piaţa europeană a centralelor solare termodinamice se pregăteşte să se confrunte cu un an «alb» în 2014, după construcţia ultimilor 350 MW care s-a încheiat în Spania în 2013. Privirile se întorc acum spre Italia, care alimentează speranţele unei relansări a sectorului în următorii doi ani. De cealaltă parte, piaţa europeană a energiei solare termice dedicată producţiei de căldură, apă caldă şi încălzire, îşi continuă declinul. Conform EurObserv’ER, aceasta se află în scădere pentru al cincilea an consecutiv, afişând de această dată o reducere cu 13,2 % faţă de anul 2012, respectiv o suprafaţă instalată cu puţin peste 3 milioane de metri pătraţi în 2013.
Biofuels barometer 2014
 6.8% the drop in biofuel consumption in European Union transport between 2012 and 2013
The growth of biofuel consumption for use in transport in the European Union (EU -28) has dwindled in the past few years and finally dropped by about 1 million toe (6.8%) between 2012 and 2013 according to EurObserv’ER , to a consumption level of 13.6 million toe. Nevertheless, sustainable biofuel consumption, certified and thus eligible for inclusion in European targets increased slightly by 1.1% to 11.8 Mtoe.
Download in English
Download in other languages : ![]()
![]()
![]()
![]()
Baromètre biocarburants 2014
 Après avoir vu sa croissance faiblir ces dernières années, la consommation de biocarburants dédiés aux transports de l’Union européenne (UE 28) a fini par reculer en 2013. Selon EurObserv’ER, la baisse serait de l’ordre d’1 million de tep par rapport à 2012, soit un niveau de consommation de 13,6 millions de tep en 2013 (- 6,8 %). En revanche, la consommation de biocarburants certifiée durable et pouvant donc être prise en compte dans les objectifs européens a elle légèrement augmenté de 1,1 % pour s’établir à 11,8 Mtep.
Biokraftstoff Barometer 2014
 6,8% Rückgang des Biokraftstoffverbrauchs im Verkehrssektor der Europäischen Union zwischen 2012 und 2013
Der Biokraftstoffverbrauch im Verkehrssektor der EU-28 war in den vergangenen Jahren rückläufig. Zwischen 2012 und 2013 fiel der Verbrauch um etwa 1 Million Tonnen Öläquivalent auf ein Niveau von 13,6 Millionen Tonnen Öläquivalent. Der Verbrauch von nachhaltig zertifiziertem Biotreibstoff, der auf die EU Ziele angerechnet werden kann, stieg jedoch leicht um 1,1% auf 11,8 Millionen Tonnen Öläquivalent.
Biuletyn energii wodnawialnej biopaliwa transportowe 2014
 6,8% spadek zużycia biopaliw w transporcie w Unii Europejskiej w latach 2012-2013
Zużycie biopaliw w transporcie w 28 krajach członkowskich Unii Europejskiej spadło w ciągu kilku ostatnich lat. Według danych konsorcjum EurObserv’ER zmniejszyło się o około 1 mln toe w stosunku do zużycia w roku 2012 (co stanowi 6,8%) i wyniosło 13,6 mln toe. Niemniej jednak, wykorzystanie biopaliw objętych certyfikacją, czyli kwalifikujących się do realizacji celów unijnych, wzrosło nieznacznie o 1,1% do poziomu 11,8 Mtoe.
Barometru biocarburanţi 2014
 -6,8 % scăderea consumului de biocarburanţi în transporturile din Uniunea Europeană între 2012 şi 2013
După o încetinire a creşterii în ultimii ani, consumul de biocarburanţi dedicaţi transporturilor în Uniunea Europeană (UE 28) a sfârşit prin a înregistra un regres în 2013. Conform EurObserv’ER, scăderea ar fi de ordinul a 1 milion tep faţă de 2012, respectiv un nivel de consum de 13,6 milioane tep în 2013 (- 6,8 %). În schimb, consumul de biocarburanţi confirmat ca durabil şi care poate fi aşadar luat în considerare în obiectivele europene a crescut uşor cu 1,1 %, stabilizându-se la 11,8 Mtep.
Biogas barometer 2014
 +10.2% Biogas primary energy production growth in 2013
The expansion of biogas energy usage has continued across the European Union. According to EurObserv’ER , about 13. 4 million tonnes oil equivalent (Mtoe) of biogas primary energy were produced during 2013, which is 1.2 Mtoe more than in 2012 representing a 10.2% growth. However, the biogas sector’s momentum was more sluggish than in 2012 (16.9% between 2011 and 2012, giving an additional 1.8 Mtoe) and it is expected to lose some of its impetus in 2014 in a number of countries whose sector expansion controlling policy changes will limit the future use of energy crops.
Download in English
Download in other languages : ![]()
![]()
![]()
![]()
Renewable municipal waste barometers 2014
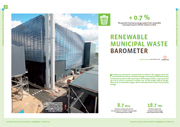 + 0.7 % The growth of primary energy output from renewable municipal waste in the EU relative to 2013
Preliminary estimates compiled by EurObserv’ER suggest that the production of primary renewable energy recovered by household refuse incineration plants in the countries of the European Union, only increased by 0.7% in 2013 to achieve 8.7 million toe. On the bright side of things, heat sales to networks surged, which reflected better use of the primary energy.
Download in English
Download in other languages : ![]()
![]()
![]()
Baromètre biogaz 2014
 + 10,2 % la croissance de la production d’énergie primaire biogaz entre 2012 et 2013.
La valorisation énergétique du biogaz a continué de progresser dans l’Union européenne. Selon EurObserv’ER, près de 13,4 millions de tonnes équivalent pétrole (Mtep) d’énergie primaire biogaz ont été produites durant l’année 2013, soit une contribution supplémentaire de 1,2 Mtep par rapport à 2012, pour une croissance de 10,2 %. L’expansion de la filière biogaz a été cependant moins rapide que l’an dernier (+ 16,9 % entre 2011 et 2012, pour 1,8 Mtep supplémentaire) et le rythme de progression devrait encore diminuer en 2014, suite à la décision politique de certains pays membres de limiter à l’avenir l’utilisation de cultures énergétiques et de contrôler l’expansion de leur filière.
Baromètre déchets urbains renouvelables 2014
 + 0,7 % La croissance de la production d’énergie primaire à partir de déchets urbains renouvelables dans l’UE entre 2012 et 2013.
Dans les pays de l’Union européenne, la production d’énergie primaire renouvelable valorisée par les unités d’incinération d’ordures ménagères (UIOM) n’aurait, selon les premières estimations recueillies par EurObserv’ER , augmenté que de 0,7 % en 2013 pour atteindre 8,7 millions de tonnes équivalent pétrole (Mtep). Point positif, la vente de chaleur destinée aux réseaux se serait accrue beaucoup plus nettement, traduisant une meilleure utilisation de l’énergie primaire.