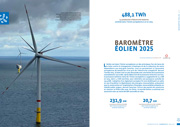
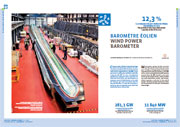
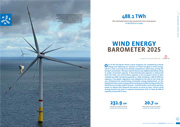
Category Archives: All Wind energy barometers

Wind energy barometer 2023

419.5 TWh The estimated electricity production from wind power in the EU of 27 in 2022
The European Union’s wind energy sector is still on track despite the disappointing state of the winds. EurObserv’ER puts newly installed capacity in 2022 at about 15 GW, including 963 MW of offshore capacity. Once the capacity of decommissioned turbines is subtracted, and replacements by more powerful units is allowed for, the net additional wind turbine capacity figure increased by at least 14.4 GW in the twelve months to the end of 2022, which amounts to 28% growth on the 2021 level (11.3 GW). While this result is a step in the right direction, the growth pace is too slow to meet the European Union’s renewable energy production targets. In 2022, wind power output picked up again after the turmoil of 2021, increasing by 8.4% to 419.5 TWh (i.e., 32.6 TWh more than in 2021).

Download in English
Download in other languages : french

Baromètre éolien 2023

419,5 TWh La production d’électricité éolienne estimée dans l’Union européenne à 27 en 2022
Malgré des vents pas toujours favorables, la filière éolienne de l’Union européenne maintient son cap. La puissance nouvellement installée en 2022 a, selon EurObserv’ER, été de l’ordre 15 GW, dont 963 MW d’éolien en mer. Prenant en compte la puissance des machines démantelées dont une partie a été remplacée par des machines plus puissantes, la puissance éolienne nette supplémentaire de l’UE a augmenté au moins de 14,4 GW entre 2021 et 2022, en croissance de 28 % par rapport à l’augmentation de la puissance nette entre 2020 et 2021 (+ 11,3 GW). Une évolution qui va certes dans le bon sens, mais un rythme de croissance insuffisant pour tenir les objectifs de l’UE en matière de production d’énergie renouvelable. La production d’électricité éolienne repart nettement à la hausse en 2022 après le « trou d’air » de 2021. Elle atteint 419,5 TWh, en croissance de 8,4 % (soit 32,6 TWh de plus qu’en 2021).

Télécharger

Wind energy barometer 2022

384.9 TWh The estimated electricity production from wind power in the EU of 27 in 2021
Although an improvement was made on the European Union’s wind energy development 2020 level, the pace is much too low to meet the EU climate targets for 2030. According to EurObserv’ER, the additional capacity installed in the European Union of 27 increased by only 11 GW including 0.6 GW of offshore capacity. The wind energy industry reckons that in order to achieve the new goal being discussed of 40% of renewable energy in final energy consumption in 2030, almost three times as much capacity needs to be installed every year. After enjoying an exceptional year for installation, with 72.1 GW in 2020, China’s installation pace slowed down in 2021 with 47.6 GW of new wind energy capacity. Part of this was 16.9 GW of offshore wind energy, with the result that China now dominates global offshore wind energy market segment.

Download in English
Download in other languages : french

Baromètre éolien 2022

384,9 TWh La production d’électricité éolienne estimée dans l’Union européenne à 27 en 2021
Bien qu’en croissance par rapport à 2020, le rythme de développement de l’énergie éolienne de l’Union européenne est beaucoup trop lent pour atteindre les objectifs climatiques qu’elle s’est fixés pour 2030. Selon EurObserv’ER, la puissance supplémentaire installée dans l’Union européenne n’a augmenté que de 11 GW, dont 0,6 GW d’éolien maritime. Selon l’industrie, il en faudrait près de trois fois plus chaque année pour atteindre l’objectif en discussion de 40 % de renouvelables dans la consommation d’énergie finale en 2030. La Chine, après une année 2020 exceptionnelle (72,1 GW installés), a ralenti son rythme d’installation en 2021 avec 47,6 GW de puissance éolienne. En revanche, le pays a ajouté en 2021 pas moins de 16,9 GW d’éolien maritime et assure désormais le leadership mondial sur ce marché.

Télécharger

Wind energy barometer 2020

426 TWh The estimated electricity production from wind power in the EU of 28 in 2019
2019 was a good year for the global wind market, which expanded in its three main zones, namely China, the United States and Europe. Given that the UK was still a Member State in 2019, the European Union’s additional capacity was upwards of 12 GW compared to just below 11 GW in 2018. The European Union of 27 (minus the UK) added about 10 GW of capacity in 2019, taking its installed base to 167.6 GW, compared to just over 8.7 GW in 2018.

Download in English

Baromètre éolien 2020

426 TWh : La production d’électricité éolienne estimée dans l’Union européenne à 28 en 2019.
2019 a été une bonne année pour le marché mondial de l’éolien, en croissance sur ses trois principales zones que sont la Chine, les États-Unis et l’Europe. Avec le Royaume-Uni, encore État membre en 2019, la puissance supplémentaire de l’Union européenne a été de plus de 12 GW contre un peu moins de 11 GW en 2018. Sans le Royaume-Uni, l’Union européenne à 27 a en 2019 ajouté une puissance de près de 10 GW contre un peu plus de 8,7 GW en 2018, portant le parc de l’UE à 27 à 167,6 GW.

Télécharger

Wind energy barometer 2019

379.3 TWh The estimated electricity production from wind power in the EU in 2018
Data released by the GWEC shows that newly-installed capacity across the globe slipped slightly (by 3.6%) in 2018 with 51.3 GW compared to 53.2 GW in 2017. This additional capacity takes total wind turbine capacity to 591 GW at the end of 2018, including 23 GW of offshore capacity. The most recent drop in the global installation figure – the third in succession – can be put down to significant contraction in the European and Indian markets that was not entirely offset by the return to growth of the Chinese and United States markets.

Download in English

Baromètre éolien 2019

379,3 TWh : production d’électricité éolienne estimée dans l’Union européenne en 2018
Selon les données du GWEC, la puissance installée dans le monde au cours de l’année 2018 était en légère diminution (- 3,6 %) par rapport à 2017, avec 51,3 GW en 2018, comparés aux 53,2 GW en 2017. Cette puissance supplémentaire porterait la puissance éolienne à 591 GW fin 2018, dont 23 GW situés en mer. Cette nouvelle baisse du niveau d’installation mondial, la troisième consécutive, s’explique cette année par une contraction importante des marchés européens et indiens qui n’a pas été entièrement contrebalancée par le retour à la croissance des marchés chinois et états-uniens.

Télécharger

Baromètre éolien 2018

353,5 TWh : production d’électricité éolienne estimée dans l’Union européenne en 2017
Le marché mondial de l’éolien est pour la deuxième année consécutive en retrait, avec cependant une baisse moins sensible en 2017. Selon EurObserv’ER, la puissance supplémentaire déduite de la puissance mise hors service devrait être de l’ordre de 51 GW en 2017, comparé à 55,5 GW en 2016. La baisse du marché mondial s’explique essentiellement par un développement plus maîtrisé du marché chinois. Le marché de l’Union européenne a quant à lui connu un surcroît d’activité, anticipant la mise en place du nouveau cadre réglementaire voulu par la Commission européenne. La puissance du parc mondial franchit allègrement le cap du demi-million de MW installés en 2017, soit 539 256 MW.

Télécharger

Wind energy barometer 2018

353,5 TWh : estimated electricity production from wind power in the EU in 2017
The global wind energy market contracted for the second year in succession. According to EurObserv’ER, the additional capacity, less decommissioned capacity, should be about 51 GW in 2017, compared to 55.5 GW in 2016. Restrained Chinese market development is the main reason for this downturn. The European Union market witnessed a flurry of activity before the new European Commission regulatory framework came into force. Installed global wind energy capacity passed the half-million MW mark in 2017, i.e. 539 256 MW.

Download in English
Download in other languages : french

Wind energy barometer 2017

302.7 TWh The estimated electricity production from wind power in the EU in 2016
The global wind energy market appears to have encountered its initial limits. Since the beginning of the millennium it has expanded almost continuously to achieve 64.4 GW in 2015. Preliminary estimates for 2016 point to sales of 54.2 GW, which is down on the previous year’s performance. Nonetheless, the results were good enough to give double digit growth of 12.4%, which took the global installed base up to 486.7 GW.

Download in English
Download in other languages : french

Baromètre éolien 2017

302.7 TWh La production d’électricité éolienne estimée dans l’Union européenne en 2016
Le marché mondial de l’éolien semble avoir trouvé ses premières limites. Après avoir augmenté de manière quasi continue depuis le début des années 2000 pour atteindre 64,4 GW en 2015, les premières estimations font état pour 2016 d’un marché annuel de 54,2 GW, en recul par rapport au marché de l’année précédente. Ces résultats permettent cependant au parc éolien mondial d’augmenter de 12,4 % pour s’établir désormais à 486,7 GW.

Télécharger

Windenergie Barometer 2017

Geschätzte Stromerzeugung aus Windenergie in der EU im Jahr 2016
Der globale Windenergie-Markt stößt offenbar erstmals an seine Grenzen. Seit Beginn des Jahrtausends war er beinah ununterbrochen gewachsen und erreichte im Jahr 2015 einen Wert von 64,4 GW. Vorläufige Schätzungen gehen für 2016 von Absatzzahlen in Höhe von 54,2 GW aus, was gegenüber den Ergebnissen des Vorjahres ein Rückgang ist. Dennoch schnitt der Markt mit einem zweistelligen Wachstumsergebnis von 12,4 % ab, sodass der Bestand der installierten Anlagen nunmehr auf 486,7 GW angewachsen ist.

Herunterladen

Wind energy barometer 2016

303.5 TWh The estimated electric production from wind power in the EU in 2015
The spectacular rise of China’s wind power market that resulted in connecting at least 30.5 GW, catapulted the global installation level to 62.7 GW in 2015– a 22% more than in 2014! The US and German markets also performed very well, the former because its tax credit mechanism remained in force and the latter because many of its offshore wind farms in the North Sea were connected to the grid. Global wind turbine capacity has increased by 17% and now stands at 432.6 GW.

Download in English
Download in other languages : french

Baromètre éolien 2016

303.5 TWh La production d’électricité éolienne estimée dans l’Union européenne en 2015
La formidable ascension du marché éolien chinois, qui a vu le raccordement d’au moins 30,5 GW, a propulsé le niveau mondial d’installation à 62,7 GW en 2015, soit 22 % de plus qu’en 2014 ! Les marchés américain et allemand ont également affiché de belles performances, le premier du fait du maintien de son crédit d’impôt, le second grâce au raccordement de nombreuses fermes offshore en mer du Nord. La puissance éolienne mondiale s’établit désormais à 432,6 GW, soit une croissance du parc mondial de l’ordre de 17 %.

Télécharger

Windenergie Barometer 2016

303.5 TWh Geschätzte Stromerzeugung aus Windenergie in der EU in 2015
Der spektakuläre Aufstieg des chinesischen Windenergiemarktes, in dessen Folge mindestens 30,5 GW angeschlossen wurden, hat das Installationsniveau im Jahr 2015 weltweit auf 62,7 GW hochschnellen lassen – ein Zuwachs von 22 % gegenüber 2014! Der US-amerikanische und deutsche Markt schnitten sehr gut ab – zum einen, weil der für den amerikanischen Markt geltende Steuergutschrift-Mechanismus auch weiterhin in Kraft ist, und zum anderen, weil viele deutsche Offshore-Windparks in der Nordsee an das Netz angeschlossen wurden. Die globale Leistung von Windkraftanlagen hat sich um 17 % erhöht und beträgt jetzt 432,6 GW.

Herunterladen

Energetyka Wiatrowa Biuletyn Energetyki Odnawialnej 2016

303.5 TWh Szacowana produkcja energii elektrycznej z farm wiatrowych w UE w 2015 r.
Spektakularny wzrost chińskiego rynku energii wiatrowej, kiedy zainstalowano co najmniej 30,5 GW, a globalny poziom instalacyjny wzrósł do 62,7 GW w 2015 r. – o 22 % więcej niż w 2014 roku! Rynki amerykańskie i niemieckie również bardzo dobrze dały sobie radę, ten pierwszy z powodu ulgi podatkowej, a drugi, ponieważ wiele z jego morskich farm wiatrowych na Morzu Północnym zostało przyłączonych do sieci. Globalne moce turbin wiatrowych wzrosły o 17% i wynoszą obecnie 432,6 GW.

Ściągnij

Wind energy barometer 2015

baro-jde16_FR10.1% The growth of the total wind power capacity in the EU in 2014
The 2014 global wind energy market surged and set a new record after the previous year’s slowdown. More than 52 GW of capacity was installed across the world compared to a little less than 37 GW in 2013. Global wind energy took a 41.4% leap in 2014 to culminate in more than 371 GW of installed capacity.

Download in English
Download in other languages : french germany poland croatia

Baromètre éolien 2015

baro-jde16_FR+ 10,1 % La croissance du parc éolien de l’UE en 2014.
Après avoir ralenti en 2013, le marché mondial de l’éolien est reparti à la hausse pour établir un nouveau record d’installation. Plus de 52 GW éoliens ont été installés dans le monde en 2014, contre une puissance d’un peu moins de 37 GW en 2013. Le marché a donc fait un bond de 41,4 % l’an dernier, portant la puissance mondiale cumulée à plus de 371 GW.

Télécharger

Biuletyn energii odnawialnej – energetyka wiatrowa 2015

EurObservER-Photovoltaic-Barometer-201510,1% Wzrost mocy zainstalowanych w UE w 2014 roku.

W 2014 roku globalny rynek energii wiatrowej powrócił na ścieżkę wzrostu po wcześniejszym okresie spowolnienia w 2013 roku. Ponad 52 GW mocy zostało zainstalowanych na całym świecie, nieco więcej niż w 2013 roku (37 GW). Dynamika wzrostu wyniosła 41,4% w 2014 roku osiągając w sumie 371 GW mocy zainstalowanej na świecie.

Ściągnij

Energija Vjetra Barometar 2015

baro-jde16_FR10,1 % rast instaliranih kapaciteta za proizvodnju električne energije iz energije vjetra u EU u 2014. godini
Nakon usporavanja u 2013. godini, globalno je tržište energije vjetra u 2014. godini dosegnulo novi rekord. Tijekom 2014. godine je diljem svijeta instalirano više od 52 GW novih kapaciteta što predstavlja skok za 41,4% u usporedbi s 2013. godinom tijekom koje je bilo instalirano nešto manje od 37 GW. Kumulativno gledano su kapacitete u vjetroelektranama instaliranim diljem svijeta tijekom 2014. godine preskočile razinu od 371 GW.

Preuzimanje

Wind energy barometer 2014

baro-jde14_en10.2 % The growth of the total wind power capacity in the EU in 2013
Global wind energy capacity increased by 12.4 % in 2013 to 318.6 GW (283.4 GW at the end of 2012), while the global market shrank to 35.6 GW shedding 10 GW. Worldwide market contraction is largely attributable to the collapse of the US market, as a result of the eleventh-hour extension of the federal incentive system. The European market also declined because of investors’ lack of confidence in the region’s new policies. If we take the United States and Europe out of the equation, the global market continued to grow, driven by the Chinese and Canadian wind power sectors.

Download in English
Download in other languages : french germany poland romania

Baromètre éolien 2014

baro-jde14-gb-150x127+ 10,2 % : La croissance du parc éolien de l’UE en 2013
La puissance mondiale de l’énergie éolienne a augmenté de 12,4 % en 2013 pour atteindre 318,6 GW (283,4 GW fin 2012). Le marché mondial est toutefois en net recul et perd 10 GW en 2013 pour atteindre 35,6 GW. La baisse du marché mondial est en grande partie attribuable à l’écroulement du marché des États-Unis, consécutif à une reconduction extrêmement tardive du système d’incitation fédéral. Le marché européen s’est également contracté en raison d’un manque de confiance des investisseurs dans les nouvelles politiques menées dans la région. En dehors des États- Unis et de l’Europe, le marché mondial a continué d’augmenter, poussé par les croissances chinoise et canadienne.

Télécharger

Windenergie Barometer 2014

baro-jde14_de+10.2% Wachstum der Gesamt-Windenergiekapazität
in der EU 2013

Die globale Windenergiekapazität stieg 2013 um 12,4 % auf 318,6 GW (283,4 GW bis Ende 2012), der globale Markt schrumpfte dagegen um 10 GW auf 35,6 GW. Die Schrumpfung des Weltmarkts geht vor allem auf den Zusammenbruch des US-Markts infolge der erst in letzter Minute beschlossenen Verlängerung des Bundes-Vergütungssystems zurück. Der europäische Markt präsentierte sich ebenfalls schwächer, da es den Investoren an Vertrauen in die neue Politik der Region fehlte. Wenn wir die USA und Europa nicht berücksichtigen, wächst der Windenergie-Weltmarkt weiter, vor allem in China und Kanada.

Herunterladen

Biuletyn energii odnawialnej – energetyka wiatrowa 2014

baro-jde14_po+10.2% Wzrost mocy zainstalowanych w UE w 2013r
W 2013 roku moc zainstalowana w energetyce wiatrowej na świecie osiagnęła 318,6 GW. Mimo, że rynek nowo zainstalowanych mocy zwiększył się o 12% osiągając 35,5 GW, to w porównaniu z rokiem 2012 odnotowano spadek dynamiki przyrostu nowych mocy zainstalowanych. Znaczący wpływ na globalne spowolnienie tempa wzrostu nowych inwestycji, miało zahamowanie na rynku amerykańskim spowodowane opóźnionym rozszerzeniem federalnego systemu wsparcia. Również rynek europejski odnotował spadek tempa wzrostu wynikający z niepewności inwestorów odnośnie nowych przepisów w poszczególnych krajach członkowskich. Poza Stanami Zjednoczonymi i Europą, światowy rynek wzrastał, napędzany przez chiński i kanadyjski sektor energetyki wiatrowej.

Ściągnij

Barometrul energei eoliene 2014

baro-jde14_ro10.2% Creşterea parcului eolian al UE în 2013
Capacitatea la nivel mondial a energiei eoliene a crescut cu 12,4 % în 2013 atingând 318,6 GW (283,4 GW la sfârşitul anului 2012). Piața globală este totuşi în regres evident, pierzând 10 GW în 2013 pentru a ajunge la 35,6 GW. Scăderea pieței mondiale poate fi atribuită în mare parte prăbuşirii pieței din Statele Unite în urma unei reînnoiri extrem de tardive a sistemului federal de bonificații. Piața europeană a intrat de asemenea în declin din cauza unei lipse de încredere a investitorilor față de noile politici promovate în regiune. În afara Statelor Unite şi a Europei, piața mondială a continuat să crească, impulsionată de creşterile înregistrate în China şi Canada.

Descărcaţi

Wind power barometer 2013

EurObservER-Wind-power-barometer-2013-baroJde12-fr-eng+12,3 % the growth of the total wind power capacity in the EU in 2012
Wind power makes further inroads into the world’s electricity mix every year. It looks as though global wind power capacity will increase by another 44 184MW in 2012, and so raise global installed capacity to more than 281 GW. Growth in 2012 was driven by the United States, which chalked up a new installation record, and Europe, which remains a safe bet in the world market. The Asian market weakened a little but its potential for this year nonetheless looks bright.

Download in English/French

Baromètre éolien 2013

EurObservER-Wind-power-barometer-2013-baroJde12-fr-eng+12,3 % La croissance du parc éolien de l’Union européenne en 2012
Chaque année, l’éolien s’insère davantage dans le mix électrique mondial. En 2012, la puissance éolienne dans le monde devrait avoir encore augmenté de 44 184 MW, ce qui porterait la puissance mondiale installée à plus de 281 GW. En 2012, les éléments positifs de croissance sont à chercher du côté des États-Unis, qui établissent un nouveau record d’installation, et du côté de l’Europe, qui reste une valeur sûre du marché mondial. Le marché asiatique a perdu un peu en intensité mais reste très prometteur pour cette année..

Télécharger

Wind power barometer 2012

EurObservER-Wind-power-barometer-2012-baroJde10-fr-eng5,9 % decrease in the EU wind turbine market registered between 2010 and 2011
Notwithstanding the economic crisis affecting most of the globe’s major economies, wind energy continues to gain supporters around the world. Global wind power capacity increased by 40.5 GW between 2010 and 2011 compared to a 39 GW rise between 2009 and 2010, after deduction of decommissioned capacity. By the end of 2011 global installed wind turbine capacity should stand at around 238.5 GW, and much of the world’s growth is being driven by capacity build-up in the emerging markets. In contrast some of the key wind energy markets may be showing fault lines.

Download in English/French

Baromètre éolien 2012

EurObservER-Wind-power-barometer-2012-baroJde10-fr-eng5,9 % la diminution du marché éolien de l’UE entre 2010 et 2011
En dépit de la crise économique qui touche aujourd’hui la plupart des grandes é conomies de la p lanète, l ’énergie éolienne cont inue d ’être plébiscitée dans le monde. La puissance éolienne mondiale a augmenté de 40,5 GW ent re 2010 et 2011 , cont re une augmentation de 39 GW entre 2009 et 2010, puissances mises hors-service déduites. La puissance instal lée du parc éolien mondial devrait s’établir à 238,5 GW fin 2011. Une grande partie de la croissance mondiale est aujourd’hui tirée par la montée en puissance de marchés émergents. A contrario, certains marchés clés de l ’éolien présentent quelques signes de faiblesse.

Télécharger

Wind power barometer 2011

EurObservER-Wind-power-barometer-2011-baro201-fr-eng5,8 % decrease in the EU wind turbine market registered between 2009 and 2010
For the first time in 20 years, growth of the global wind power market faltered, stumbling by 5.8% to 35.7 GW in 2010 (37.9 GW in 2009). The North American market has taken a knock and the European market has slowed down. On the other hand Asian market growth has crept up steadily and now has a grip on more than half the global market.

Download in English/French

Baromètre éolien 2011

EurObservER-Wind-power-barometer-2011-baro201-fr-eng5,8% la diminution du marché éolien de l’Union européenne entre 2009 et 2010
Le marché mondial de l’éolien est pour la première fois depuis 20 ans en diminution, baissant de 5,8 % à 35,7 GW en 2010 (37,9 GW en 2009). Cette diminution s’explique par la chute du marché nord-américain et par un ralentissement du marché européen. La croissance du marché asiatique est restée très soutenue et concentre désormais plus de la moitié du marché mondial.

Télécharger

Wind power barometer 2010

Cover Wind power barometer 2010+13,3% EU wind turbine market growth between 2008 and 2009
The global wind power market not only repelled the strictures of the financial crisis,but according to initial estimates, saw the installation of 37 GW, which is almost 10 GW up on 2008. China and the United States registered particularly steady growth and the European Union also picked up momentum to break its installation record.

Download in English/French

Baromètre éolien 2010

Cover Wind power barometer 2010+ 13,3 % la croissance du marché éolien de l’UE entre 2008 et 2009
Le marché mondial de l’éolien a fait mieux que résister aux effets de la crise financière avec, selon les premières estimations, l’installation de 37 GW, soit près de 10 GW de puissance supplémentaire par rapport à l’année 2008. La croissance a été particulièrement soutenue en Chine et aux États-Unis. L’Union européenne a également tiré son épingle du jeu en établissant un nouveau record d’installations.

Télécharger