
EurObserv’ER – Webinar
23nd Annual Overview Barometer
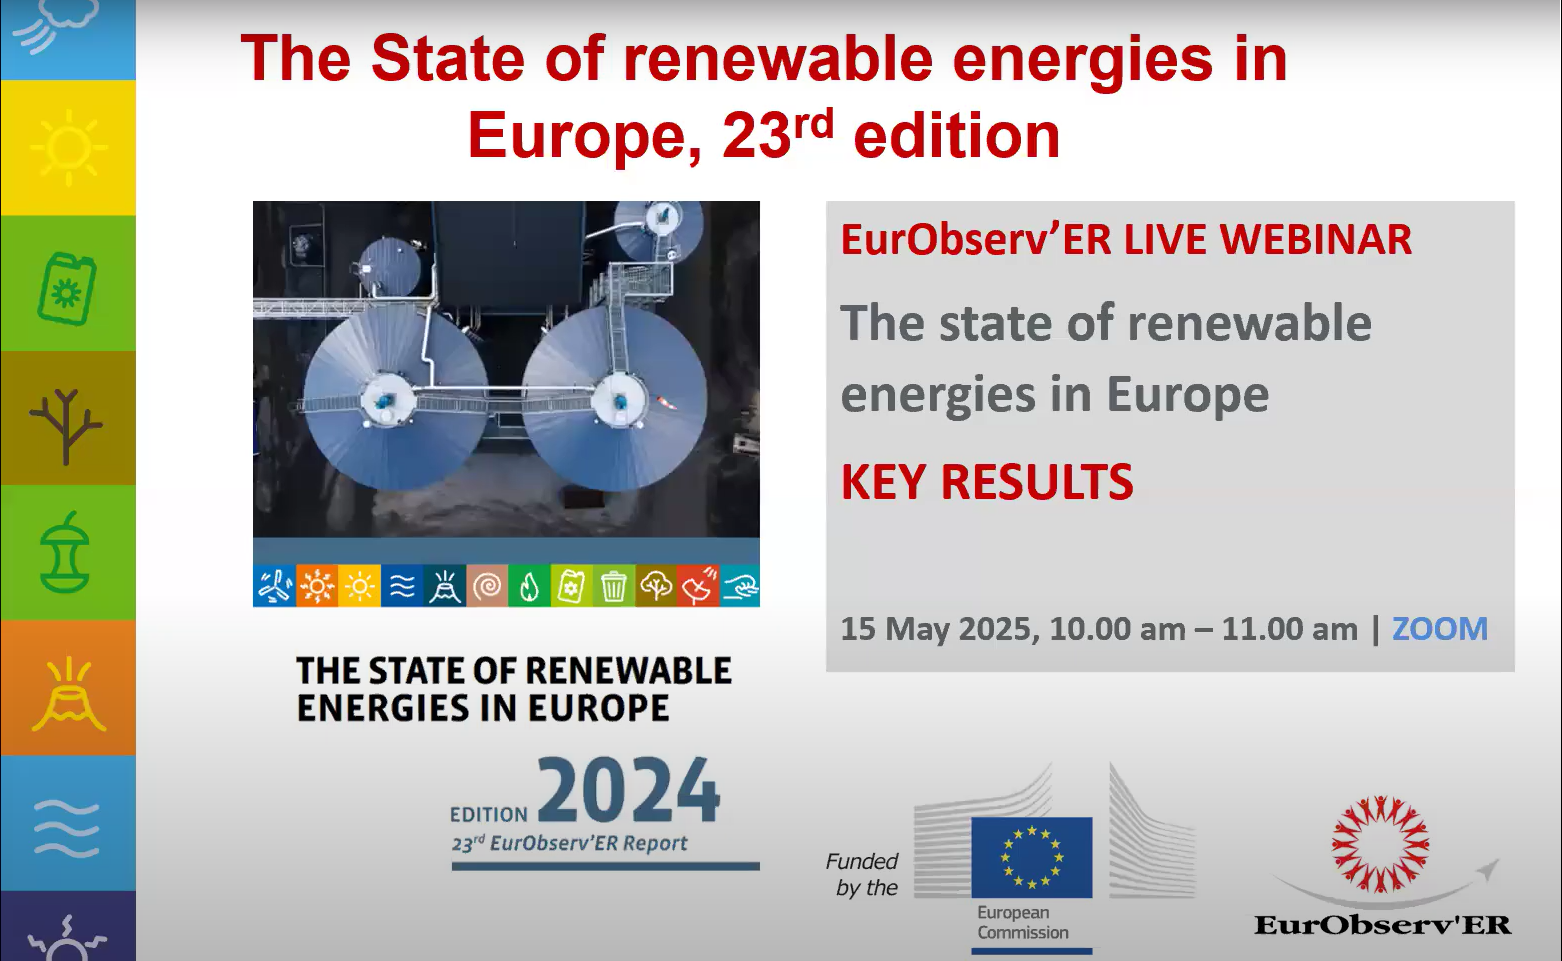
EurObserv’ER invites you to watch the recording of our free live webinar, featuring the main results of the recently released Annual Report The State of Renewable Energies in Europe (23rd edition).
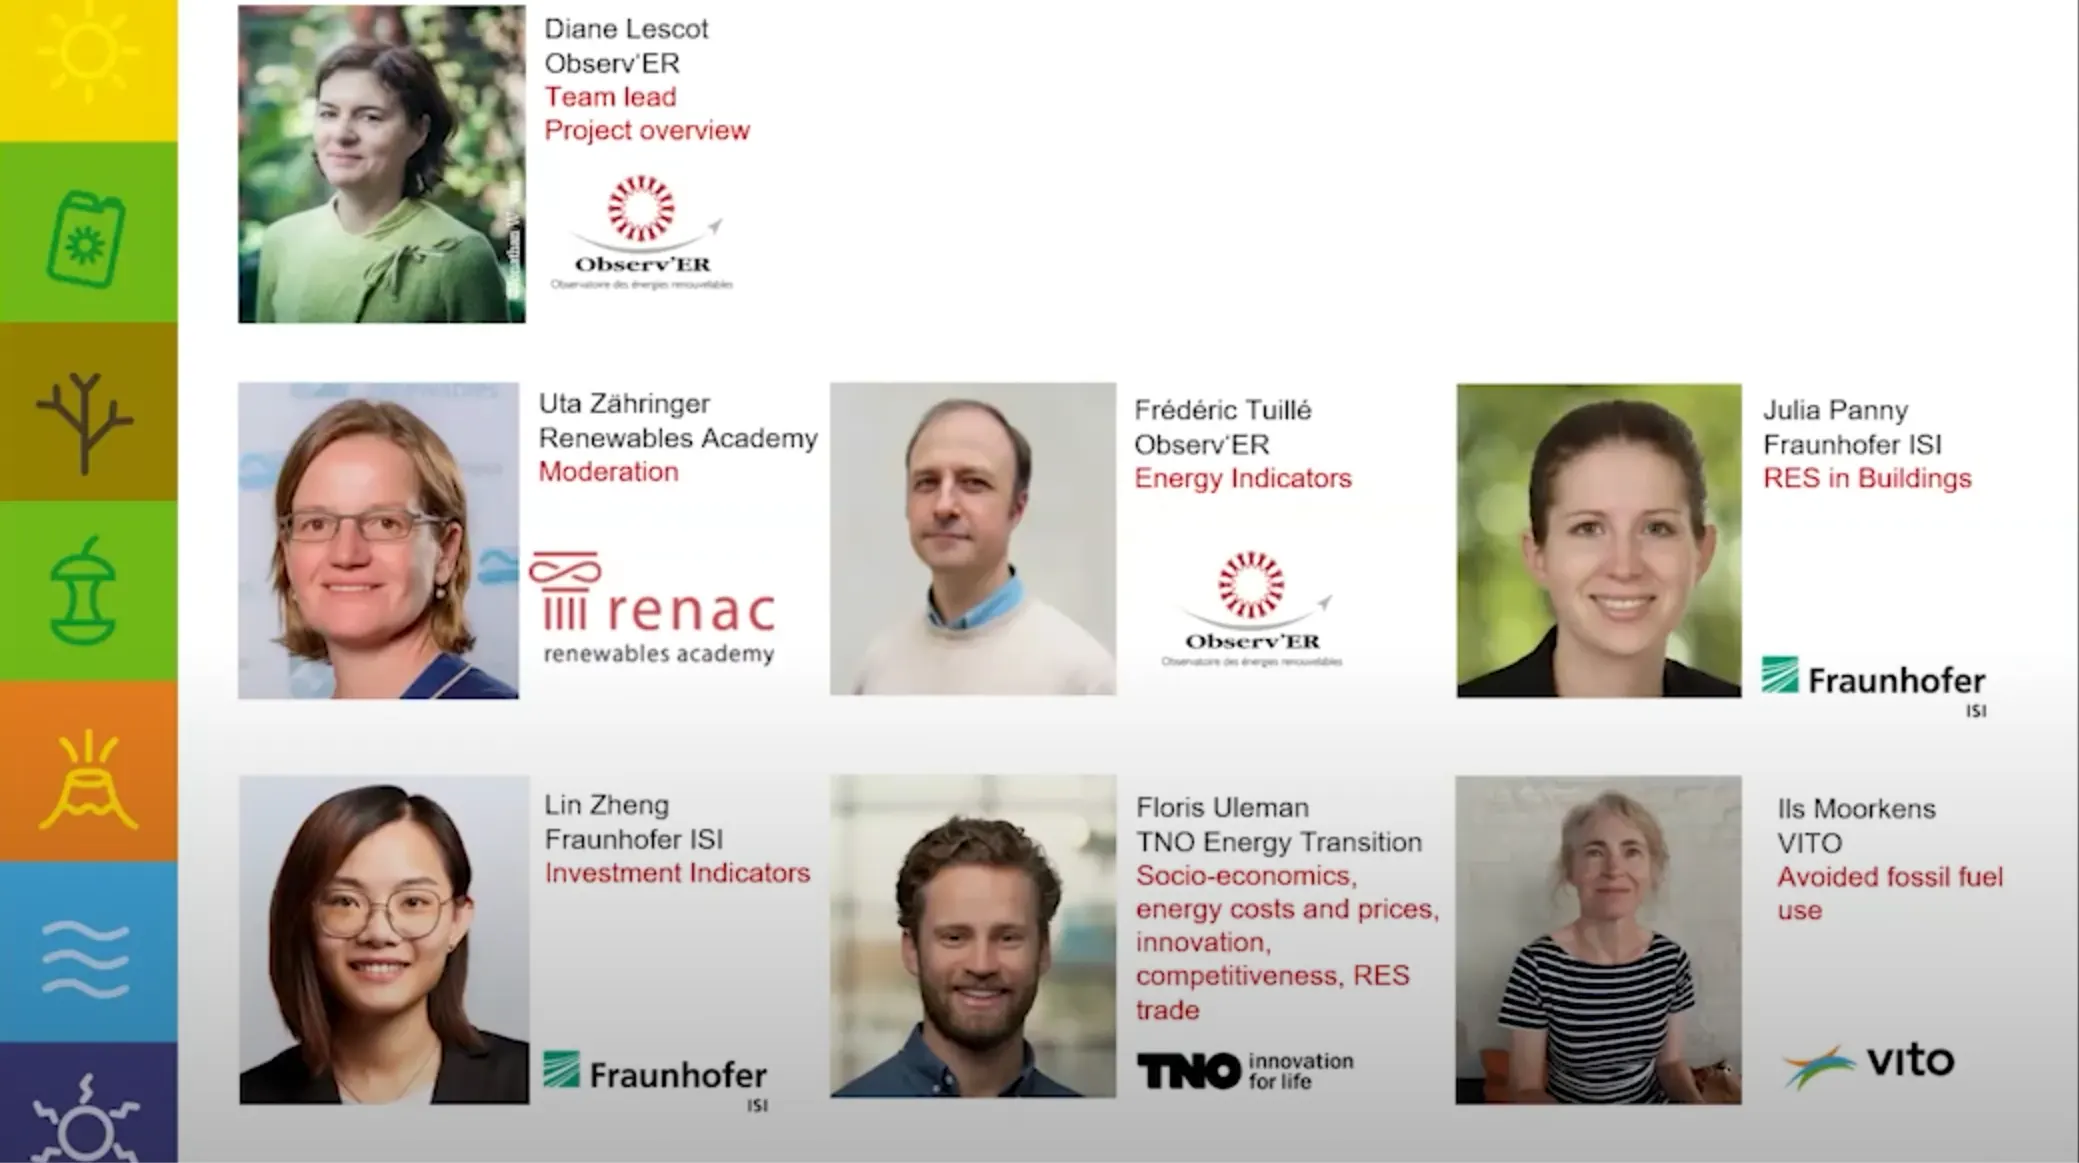
Speakers:
- Diane Lesco: Team leader at Observ-er, presented a general overview of the Observer project, which started in 1999.
- Uta Zähringer: Moderator, head of the Department of Academic Programs at Renewables Academy, Berlin.
- Kathia Terzi: Discussed energy indicators, highlighting challenges and progress in installed capacity and energy production.
- Julia Panny: Researcher at Fraunhofer ISI, presented indicators on renewable energy sources in buildings, focusing on heating and cooling as well as on the self-consumption of photovoltaic installations.
- Floris Uleman: From TNO Energy Transition, discussed the costs of renewable energies and their competitiveness, as well as the impact on employment and the savings achieved through the reduction of fossil fuel use and greenhouse gas emissions.
- Ils Moorkens: Researcher at VITO, covered avoided fossil fuel use and avoided greenhouse gas emissions
The webinar presented the key results on:
- Energy indicators (installed RES in EU-27, RES in buildings)
- Socio-economic indicators (jobs and turnover gross added value)
- Investment indicators
- Renewable energy costs and energy prices
- Avoided fossil fuel use and resulting avoided costs and GHG emissions
- Indicators on innovation, competitiveness, and international trade
Join this enlightening session to better understand how Europe is moving towards a more sustainable future through renewable energy.
The recording is already up on our YouTube channel.
EurObserv’ER has been gathering information and data on renewable energy sources in the EU for more than twenty years to describe the state and development of the sectors in themed barometers. The first part of this opus is a summary per RES sector, communicating the main tendencies in each sector for the years 2022 and 2023.
The following chapters supply socioeconomic indicators on employment and turnover, investment costs, avoided fossil fuel use and resulting avoided expenses and GHG emissions thanks to the development of the RES sectors. They also provide for an insight on EU competitiveness and innovation capability regarding renewable energy technologies.