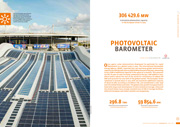
Category Archives: All Photovoltaic barometers

Photovoltaic barometer 2023

195 413.2 mw Cumulative photovoltaic capacity in the European Union in 2022
Solar photovoltaic energy is keeping its shine. Initial assessments of the net maximum capacity connected to grids worldwide in the twelve months to the end of 2022 indicate at least 191.5 GWac (ac for alternative current), which would take global capacity up to 1 046.6 GWAC. The expansion of industrial module and electrochemical storage manufacturing capacities is hastening solarization of the global electricity mix. The European Union, having connected at least 32.8 GWac of net maximum capacity in 2022 and 195.4 GWac of capacity to date, is eyeing new heights. Its combined solar power output of 205.2 TWh, boosted by the record sunshine levels of 2022, increased by 29.6% (by 46.9 TWh) on its 2021 performance.

Download in English

Baromètre Photovoltaïque 2023

195 413,2 MWac la capacité photovoltaïque cumulée dans l’Union européenne fin 2022
L’énergie solaire photovoltaïque n’en finit pas de rayonner. Les premières estimations de la puissance maximale nette raccordée dans le monde durant l’année 2022 font état d’au moins 191,5 GWac (ac pour courant alternatif), portant la puissance mondiale à au moins 1 046,6 GWac à fin 2022. La solarisation du mix électrique mondial est en train de s’accélérer en cohérence avec la montée en puissance des capacités industrielles de production de modules, ainsi que celles du stockage électrochimique. Quant à l’Union européenne, elle tutoie de nouveau les sommets avec au moins 32,8 GWac de puissance maximale nette raccordée en 2022 et 195,4 GWac de puissance cumulée. La production d’électricité solaire de l’UE, qui a bénéficié d’un ensoleillement record en 2022, est en augmentation de 29,6 % par rapport à 2021 (+ 46,9 TWh), soit une production cumulée de 205,2 TWh en 2022.

Télécharger en Français
Download in other languages : english

Photovoltaic barometer 2022

158 911.4 mw Cumulative photovoltaic capacity in the European Union in 2021
The solar photovoltaic market upturn held up well in spite of the increase in energy and solar system component prices that characterised 2021 across the globe. The International Renewable Energy Agency (IRENA) put worldwide maximum net installed solar capacity at 843.1 GW at the close of the year, which equates to 133.6 GW of new capacity in 12 months. More than half of this additional capacity was installed in Asia (53.7%), while Europe and North America ran neck and neck with 17.2% and 16.5% respectively. The EurObserv’ER consortium’s calculations conclude that the European Union of 27 added maximum net capacity of 22.3 GW, which takes the European base to date to 158.4 GW after subtracting decommissioned capacity.

Download in English
Download in other languages : french   

Baromètre Photovoltaïque 2022

158 911,4 mw Capacité photovoltaïque cumulée dans l’Union européenne fin 2021
Le solaire photovoltaïque a durant l’année 2021 poursuivi son ascension, malgré un contexte mondial marqué par une augmentation des prix de l’énergie et des composants des systèmes solaires. Selon l’Agence internationale pour les énergies renouvelables (IRENA), la puissance solaire maximale nette installée dans le monde a atteint 843,1 GW fin 2021, soit une puissance supplémentaire connectée de 133,6 GW par rapport à 2020. Plus de la moitié cette puissance supplémentaire a été installée en Asie (53,7 %), tandis que l’Europe et l’Amérique du Nord ont fait jeu égal avec respectivement 17,2 % et 16,5 %. Selon le décompte d’EurObserv’ER, l’Union européenne à 27 a ajouté une puissance maximale nette de 22,8 GW portant la puissance cumulée du parc européen à 158,9 GW déduit de la puissance mise hors service.

Télécharger en Français
Download in other languages : english

Photovoltaic barometer 2020

130 670 MW Cumulative photovoltaic capacity in the EU 28 at the end of 2019
The amount of solar photovoltaic capacity installed across the world in 2019 is lower than expected. It will just pass the 100-GW threshold, which is much the same as in 2018 (which the IEA PVPS experts reassessed at 103.6 GW in December 2019), and enough to pass the half-million installed megawatts threshold worldwide. In 2019, the Chinese market’s continuing and greater than forecast decline, was offset by strong growth in the other markets, the United States and European markets in particular. The global Covid-19 pandemic, its effects on the global production, distribution and installation circuits, and the ensuing global economic recession will naturally have an impact on the 2020 market, even if it is too early to quantify.

Download in English

Baromètre Photovoltaïque 2020

130 670 MW La puissance photovoltaïque cumulée
de l’Union européenne à 28 fin 2019

Contrairement aux prévisions plus optimistes, la puissance solaire photovoltaïque installée dans le monde en 2019 devrait finalement se contenter de dépasser légèrement le seuil des 110 GW. Ce volume d’installation, un peu plus élevé que celui de 2018 (qui a été réévalué en décembre 2019 à 103,6 GW par les experts de l’AIE PVPS), devrait toutefois suffire à porter le niveau des installations mondiales nettement au-dessus du seuil des 600 GW. En 2019, la nouvelle baisse, plus franche que prévu, du marché chinois a été contrebalancée par la forte croissance d’autres marchés, états-unien et européen en particulier. La pandémie mondiale du Covid-19, ses conséquences sur les circuits mondiaux de production, de distribution et d’installation et la récession économique mondiale qu’elle va engendrer aura logiquement un impact sur le marché 2020, même si ce dernier est encore difficile à quantifier.

Télécharger en Français
Download in other languages : english

Photovoltaic barometer 2019

114 549 MW Cumulative photovoltaic capacity
in the European Union at the end of 2018

The global photovoltaic base continues to make inroads across the five continents. At the end of 2018, its capacity exceeded half a million megawatts, which equates to about 100 GW of newly-installed capacity. In 2018, China’s market faltered, while there was a revival in the European Union market and the emerging markets picked up steam.

Download in English

Baromètre Photovoltaïque 2019

114 549 mW La puissance photovoltaïque cumulée de l’Union européenne fin 2018
Le parc mondial photovoltaïque continue de s’étendre sur les cinq continents. Fin 2018, il a dépassé le demi-million de mégawatts, soit une capacité supplémentaire installée de l’ordre de 100 GW. L’année se caractérise par le recul du marché chinois, la renaissance de l’Union européenne et une montée en puissance des marchés émergeants.

Télécharger en Français
Download in other languages : english

Baromètre Photovoltaïque 2018

106 606 MW de puissance photovoltaïque cumulée connectée fin 2017 dans l’Union européenne
La croissance spectaculaire de l’électricité solaire, qui s’appuie sur des bases industrielles extrêmement solides, fait du photovoltaïque un des piliers de la transition énergétique mondiale. En 2017, ont été installés dans le monde près de 100 GW, dont un peu plus de la moitié en Chine. Le marché mondial a représenté à peine moins que la totalité du parc installé de l’Union européenne. Ce dernier culmine fin 2017 à 106,6 GW, soit 5,6 GW de plus qu’en 2016. Si la production photovoltaïque peut encore paraître arginale au niveau mondial, représentant un peu plus de 2 % du mix électrique en 2017, elle compte déjà pour près de 6 % au Japon, et plus de 7 % en Allemagne et en Italie.

Télécharger en Français
Download in other languages : english

Photovoltaic barometer 2018

106 606 MW Cumulative photovoltaic capacity in the European Union at the end of 2017
The spectacular growth of solar power based on solid industrial bases, makes photovoltaic one of the mainstays of global energy transition. In 2017, roughly 100 GW was installed worldwide, and just over half of that in China. The global market amounted to slightly less than half the European Union’s installed base. The EU ended the year at 106.6 GW, i.e. 5.6 GW more than in 2016. While at just over 2% in 2017 solar photovoltaic output may still seem negligible on a global level, photovoltaic already supplies about 6% of the electricity mix in Japan, and more than 7% in Germany and Italy.

Download in English
Download in other languages : french

Photovoltaik Barometer 2017

2017_Baro_PV_tableaux_DE_final-1100 935 MWp in der Europäischen Union Ende 2016
Der globale Solarenergiemarkt entwickelt sich rasant – angetrieben von der enormen Nachfrage auf den asiatischen und amerikanischen Märkten. 2016 knackte der globale Photovoltaik-Markt die 76-GW-Marke und erreichte einen maximalen Zuwachs von 50 %. Der europäische Markt hingegen scheint sich festgefahren zu haben. Die dort zugebaute Leistung betrug 2016 lediglich 6,1 GW und lag damit unter den 7,9 GW des Vorjahres. Um den Marktanteil von Strom aus erneuerbaren Quellen in Zukunft zu vergrößern, werden die gesetzlichen Rahmenbedingungen des Sektors derzeit überarbeitet.

Herunterladen

Photovoltaic barometer 2017

100 935 MWp in the European Union at the end of 2016
Not just a wave, it’s a breaker that has made landfall on the global solar power market, driven by strong Asian and American demand. The global solar photovoltaic market surged past the 76 GW mark in 2016, with peak growth at 50%. The European market seems to have drifted into slack water. It connected only 6.1 GW of additional capacity in 2016 and in doing so slipped below the previous year’s figure of 7.9 GW. The sector’s regulatory framework is being overhauled with a view to integrating more renewably-sourced electricity into the market.

Download in English
Download in other languages : french     germany

Baromètre photovoltaïque 2017

100 935 MWc dans l’Union européenne fin 2016
Plus qu’une vague, c’est une déferlante qui s’est abattue sur le marché mondial de l’électricité solaire, poussée par une forte demande des marchés asiatiques et américains. Le marché mondial du solaire photovoltaïque aurait dépassé les 76 GW en 2016, soit un pic de croissance de 50 %. Le marché européen obéit à une dynamique différente, seuls 6,1 GW supplémentaires ont été raccordés en 2016, soit une contraction par rapport aux 7,9 GW de 2015. Le secteur fait actuellement face à une réorganisation de son cadre réglementaire visant à intégrer davantage les énergies renouvelables électriques au marché.

Télécharger

Photovoltaic barometer 2016

94,568 MWp in the European Union at the end of 2015
The European Union solar photovoltaic market picked up in 2015 after three successive years of decline. It registered 3% growth over the twelve-month period, by installing 7 226 MW, which took Europe’s installed capacity to date to 94.6 GW. The global market soared by comparison, gaining 25% year-on-year and connecting at least 50 GW, which took global PV capacity past the 227-GW mark.

Download in English
Download in other languages : french

Baromètre photovoltaïque 2016

94,568 MWc dans l’Union européenne fin 2015
En 2015, le marché du solaire photovoltaïque de l’Union européenne est reparti à la hausse, après trois années consécutives de baisse. 7 226 MW ont été installés dans l’année, soit une croissance de 3 %, portant la puissance cumulée du parc européen à 94,6 GW. Quant au marché mondial, il a atteint des sommets : au moins 50 GW connectés en 2015, soit une croissance de 25 % par rapport à 2014. Fin 2015, la puissance photovoltaïque mondiale dépassait les 227 GW.

Télécharger

Photovoltaic barometer 2015

EurObservER-Photovoltaic-Barometer-201586 674 MWp in the European Union at the end of 2014
The global photovoltaic market continued to expand between 2013 and 2014, rising from 37.6 GW to almost 40 GW unlike the European Union market that plummeted further. The EurObserv’ER estimate of the European photovoltaic market is about 6.9 GWp in 2014, a 32.3 % drop on 2013, yet three years earlier, in 2011, it hovered around the 22 GWp mark.

Download in English
Download in other languages : french germany

Baromètre photovoltaïque 2015

EurObservER-Photovoltaic-Barometer-201586 674 MWc dans l’Union européenne fin 2014
Alors que le marché mondial du photovoltaïque a continué de croître entre 2013 et 2014, passant de 37,6 GWc à près de 40 GWc, celui de l’Union européenne a, lui, poursuivi son décrochage. Selon EurObserv’ER, le marché du photovoltaïque en Europe devrait se situer aux alentours de 6,9 GWc en 2014, en baisse de 32,3 % par rapport à 2013. Trois ans plus tôt, en 2011, il s’établissait à près de 22 GWc…

Télécharger

Photovoltaik Barometer 2015

EurObservER-Photovoltaic-Barometer-201586 674 MWp in der Europäischen Union Ende 2014
Der globale PV-Markt ist zwischen 2013 und 2014 weiter gewachsen und stieg von 37,6 GW auf fast 40 GW – im Gegensatz zum EU-Markt, der weiter eingebrochen ist. Die Schätzung von EurObserv’ER für den europäischen Photovoltaik-Markt beläuft sich für 2014 auf 6,9 GWp, was gegenüber 2013 einen Rückgang von 32,3 % bedeutet, während der Markt sich noch drei Jahre zuvor bei rund 22 GWp eingependelt hatte.

Herunterladen

Biuletyn energii odnawialnej fotovoltaika 2015

86 674 MWp moc zainstalowana w Unii Europejskiej w 2014 roku
Światowy rynek fotowoltaiczny po raz kolejny wzrósł w latach 2013-2014 z 37,6 GW do niemal 40 GW, w odróżnieniu od rynku Unii Europejskiej, który zanotował dalszy, silny spadek. Szacunki konsorcjum EurObserv’ER pozycjonują go na ok, 6,9 GWp w 2014 roku, co oznacza spadek o 32,3% w stosunku do roku 2013, podczas gdy trzy lata wcześniej, w 2011 roku, oscylował wokół progu 22 GWp.

Ściągnij

Barometar Fotonapona 2015

EurObservER-Photovoltaic-Barometer-201586 674 MWp u Europskoj Uniji krajem 2014. godine
Globalno tržište fotonapona nastavilo se širiti tijekom 2013. i 2014. godine, povećavši se s 37,6 GW na gotovo 40 GW, za razliku od tržišta Europske Unije koje je dodatno potonulo. Procjena EurObserv’ER a za europsko tržište fotonapona je oko 6,9 GWp u 2014. godini što je pad od 32,3% u usporedbi s 2013. godinu, a tri godine ranije, 2011. godine vrtilo se oko 22 GWp.

Preuzimanje

Photovoltaic barometer 2014

baro-jdp1178 798 MWp in the European Union at the end of 2013
The global solar photovoltaic market enjoyed a strong revival in 2013. Preliminary estimates put it in excess of 37 GWp, compared to 30 GWp in 2012 and 2011. The solar photovoltaic sector led the annual installed capacity ratings for renewable energies, taking worldwide capacity up to 137 GWp by the end of the year … a 35% year-on-year increase. At global level the high growth markets – China, Japan and America – contrast sharply with the contracting European Union market.

Download in English
Download in other languages : french germany poland romania

Baromètre photovoltaïque 2014

jdp11_fr78 798 MWc dans l’Union européenne fin 2013

Le marché mondial du solaire photovoltaïque s’est nettement relancé en 2013. Selon les premières estimations, il aurait dépassé les 37 GWc en 2013, contre environ 30 GWc en 2011 et 2012. Le solaire photovoltaïque devient donc la première filière énergie renouvelable au titre de la puissance annuelle installée. Celle-ci atteint désormais 137 GWc fin 2013 dans le monde, ce qui constitue une croissance de 35 % par rapport à l’année précédente. On observe un contraste saisissant entre la forte croissance des marchés chinois, japonais et américain et la baisse sensible du marché de l’Union européenne.

Télécharger

Photovoltaik Barometer 2014

jdp11_de78 798 MWp in der Europäischen Union Ende 2013
Der globale Photovoltaik-Markt erholte sich 2013 deutlich. Nach vorläufigen Schätzungen beläuft sich der Zubau auf über 37 GWp, nach etwa 30 GWp in den Jahren 2012 und 2011. Der Photovoltaik-Sektor weist den größten Leistungszubau aller erneuerbarer Energietechnologien auf. Bis Ende des Jahres stieg die weltweit installierte Kapazität auf 137 GWp, was im Jahresvergleich einem Anstieg von 35 % entspricht. Auf globaler Ebene ist dennoch ein starker Kontrast zwischen den Märkten mit großem Wachstum – China, Japan und Amerika – und dem schrumpfenden Markt der Europäischen Union zu verzeichnen.

Herunterladen

Biuletyn energii odnawialnej – fotowoltaika 2014

jdp11_po 78 798 MWp w Unii Europejskiej w 2013
W roku 2013 światowy rynek fotowoltaiki charakteryzował się silnym ożywieniem. Wstępnie szacuje się roczny przyrost mocy zainstalowanej na poziomie 37 GWp, w porównaniu do 30 GWp w 2012 i 2011 roku. Wyniki sektora fotowoltaicznego wpłynęły pozytywnie również na bilanse zielonej energii uwzględniające wszystkie odnawialne źródła energii. Całkowite moce zainstalowane PV na świecie osiągnęły pod koniec roku sumaryczną moc 137 GWp, z rocznym przyrostem rzędu 35%. W kontekście rynku światowego, dynamicznie rozwijające się rynki PV w Chinach, Japonii i Stanach Zjednoczonych wyraźnie kontrastują z kurczącym się rynkiem Unii Europejskiej.

Ściągnij

Barometrul energiei fotovoltaice 2014

jdp11_ro78 798 MWp în UE la finele lui 2013
Piaţa mondială a energiei solare fotovoltaice s-a relansat puternic în 2013. Conform primelor estimări, aceasta ar fi depăşit 37 GWp în 2013, faţă de aproximativ 30 GWp în 2012 şi 2011. Sectorul energetic fotovoltaic devine aşadar primul domeniu energetic regenerabil din punct de vedere al puterii anuale instalate. Aceasta a ajuns deja la 137 GWp la sfârşitul anului 2013 la nivel mondial, ceea ce reprezintă o creştere de 35 % faţă de anul precedent. Se observă un contrast puternic între creşterea puternică a pieţelor din China, Japonia şi Statele Unite şi scăderea sensibilă a pieţei Uniunii Europene.

Descărcaţi

Photovoltaic Barometer 2013

EurObservER-Photovoltaic-barometer-2013-baroJdpv9-fr-eng68 647,2 MWp in the European Union at the end of 2012
After the euphoria of 2011, the European Union’s photovoltaic market slowed right down in 2012. EurObserv’ER puts newly-connected capacity in 2012 at 16.5 GWp compared to 22 GWp in 2011, which is a 25% slide. At global level the market generally held up, with just over 30 GWp installed, bolstered by the build-up of the America and Asian markets.

Download in English/French

Baromètre photovoltaïque 2013

EurObservER-Photovoltaic-barometer-2013-baroJdpv9-fr-eng68 647,2 MWc dans l’Union européenne fin 2012
Après une année 2011 euphorique, le marché photovoltaïque de l’Union européenne a nettement décéléré en 2012. Selon EurObserv’ER, la puissance nouvellement connectée s’établit en 2012 à 16,5 GWc contre 22 GWc en 2011, soit une baisse de 25 %. Dans le monde, le niveau du marché est globalement resté stable, avec un peu plus de 30 GWc installés, maintenu par la montée en puissance des marchés américain et asiatique.

Télécharger

Baromètre photovoltaïque 2013

100 935 MWc dans l’Union européenne fin 2013
Plus qu’une vague, c’est une déferlante qui s’est abattue sur le marché mondial de l’électricité solaire, poussée par une forte demande des marchés asiatiques et américains. Le marché mondial du solaire photovoltaïque aurait dépassé les 76 GW en 2016, soit un pic de croissance de 50 %. Le marché européen obéit à une dynamique différente, seuls 6,1 GW supplémentaires ont été raccordés en 2016, soit une contraction par rapport aux 7,9 GW de 2015. Le secteur fait actuellement face à une réorganisation de son cadre réglementaire visant à intégrer davantage les énergies renouvelables électriques au marché.

Télécharger

Photovoltaic Barometer 2012

EurObservER-Photovoltaic-barometer-2012-baroJdpv7-fr-eng51 357,4 MWp in the EU at the end of 2011
The global photovoltaic market has continued to expand despite the economic and financial crisis. Capacity in excess of 29 000 MWp was connected in 2011, which is roughly 12 200 MWp more than in 2010. The European Union is still the main hive of installation activity. It added more than 21 500 additional MWp of capacity to the grid last year, while outside the EU, the surging Chinese, American and Japanese markets vouch for the enormous growth potential offered by solar power worldwide.

Download in English/French

Baromètre photovoltaïque 2012

EurObservER-Photovoltaic-barometer-2012-baroJdpv7-fr-eng51 357,4 MWc dans l’UE fin 2011
Malgré la crise économique et financière, le marché mondial du photovoltaïque a continué son ascension. Plus de 29 000 MWc ont été raccordés en 2011, soit environ 12 200 MWc de plus qu’en 2010. L’Union européenne est demeurée la principale zone d’installation avec plus de 21 500 nouveaux MWc connectés l’an dernier. Hors Union européenne, la montée en puissance des marchés chinois, américain et japonais confirme l’énorme potentiel de croissance de l’électricité solaire au niveau mondial.

Télécharger

Photovoltaic Barometer 2011

EurObservER-Photovoltaic-barometer-2011-baro202-fr-eng29327,7 MWp in the EU
The photovoltaic sector is continuing on track, just as the extent of solar energy’s electricity-generating potential is dawning on the public mind. The annual global installation figure was up more than twofold in 2010 (rising from just short of 7 000 MWp in 2009). It leapt to over 16 000 MWp, bringing worldwide installed photovoltaic capacity close to 38000 MWp.

Download in English/French

Baromètre photovoltaïque 2011

EurObservER-Photovoltaic-barometer-2011-baro202-fr-eng29327,7 MWc dans l’UE
Alors que l’opinion publique commence tout juste à prendre conscience du potentiel que représente l’énergie solaire pour la production d’électricité, la filière photovoltaïque continue son ascension. Plus de 16000 MWc ont été installés dans le monde en 2010, soit plus du double par rapport à 2009 (près de 7000 MWc). La puissance photovoltaïque installée cumulée dans le monde s’établit désormais à près de 38000 MWc.

Télécharger

Baromètre photovoltaïque 2010

Cover Photovoltaic barometer 2010 15861,2 MWc dans l’EU
Le marché mondial du photovoltaïque a continué sa progression en 2009. L’onde de choc générée par le verrouillage du marché ibérique a pu être contenue grâce à un nouveau record d’installation en allemagne et par la montée en puissance des nouveaux grands marchés du solaire photovoltaïque. L’Union européenne reste le principal lieu d’implantation des centrales photovoltaïques, avec près de 5,5 GWc installés durant l’année 2009.

Télécharger