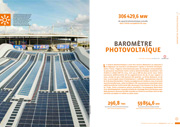
Category Archives: 2024

Photovoltaic barometer 2024

256 911.8 mw Cumulative photovoltaic capacity in the European Union in 2023
Solar photovoltaic had an outstanding year in 2023. IRENA reported that over 345.5 GW of capacity was installed globally compared to 199.1 GW in 2022 and 145.1 GW in 2021 (net maximum capacity installed and connected at the end of the calendar year). Thus, installed global capacity to date rose to 1 412.1 GW. The European Union and United States enjoyed unheard of increases in their solar photovoltaic capacities. Yet, they pale by comparison with the unbridled rise of photovoltaic in China, which installed 216.9 GW in 2023… more than the previous year’s total global market. With net maximum capacity standing at 53.1 GW in 2023 as quantified by EurObserv’ER, the European Union is the world’s No. 2 market, ahead of the United States, which added 27.1 GW.

Download in English

22nd annual overview barometer

Webinar - 22nd annual overview barometer
Play Video about Webinar - 22nd annual overview barometer

EurObserv’ER – Webinar
22nd Annual Overview Barometer

Join us to discover the significant advancements and current challenges of renewable energies in Europe, showcased in the 22nd annual report on this critical topic. This webinar highlights the work of our experts who have analyzed trends, investments, and the socio-economic impact of renewable energies across the continent.

Speakers:

  • Uta Zähringer: Moderator, head of the Department of Academic Programs at Renewables Academy, Berlin.
  • Diane Lesco: Team leader at Observ-er, presented a general overview of the Observer project, which started in 1999.
  • Frederic Tuillé: Discussed energy indicators, highlighting challenges and progress in installed capacity and energy production.
  • Julia Panny: Researcher at Fraunhofer ISI, presented indicators on renewable energy sources in buildings, focusing on heating and cooling as well as on the self-consumption of photovoltaic installations.
  • Lin Zheng:  Fraunhofer ISI, Addressed investment indicators, noting a significant increase in investments in photovoltaics compared to wind power.
  • Floris Uleman: From TNO Energy Transition, discussed the costs of renewable energies and their competitiveness, as well as the impact on employment and the savings achieved through the reduction of fossil fuel use and greenhouse gas emissions.

The webinar presented the key results on:

  • Energy indicators (installed RES in EU-27, RES in buildings)
  • Socio-economic indicators (jobs and turnover gross added value)
  • Investment indicators
  • Renewable energy costs and energy prices
  • Avoided fossil fuel use and resulting avoided costs and GHG emissions
  • Indicators on innovation, competitiveness, and international trade

Join this enlightening session to better understand how Europe is moving towards a more sustainable future through renewable energy.

The recording is already up on our YouTube channel

EurObserv’ER has been gathering information and data on renewable energy sources in the EU for more than twenty years to describe the state and development of the sectors in themed barometers. The first part of this opus is a summary per RES sector, communicating the main tendencies in each sector for the years 2021 and 2022.

The following chapters supply socioeconomic indicators on employment and turnover, investment costs, avoided fossil fuel use and resulting avoided expenses and GHG emissions thanks to the development of the RES sectors. They also provide for an insight on EU competitiveness and innovation capability regarding renewable energy technologies.

Continue reading

Wind energy barometer 2024

476.6 TWh The estimated electricity production from wind power in the EU of 27 in 2023
The European Union wind energy industry has put a spate of alerts and uncertainties behind it as the market bullishly eyes renewed growth prospects. The connection figures for 2023, mark a year of transitioncommensurate with the final investment decisions of previous years. EurObserv’ER’s figure for newly installed capacity installation in 2023 is at least 15.6 GW, which once decommissioned capacity for the year is subtracted, takes European Union capacity in service to 218.5 GW. Leaving Europe aside, China’s annual installation figure more than doubled that of 2022, approaching a stunning 76 GW, and took its total capacity in service by the end of 2023 to 441.3 GW. This exceptional growth enabled wind energy to push its 12-month worldwide installation figure past the 100-GW mark for the first time, and with it thrust the total global wind energy capacity installation figure to over one terawatt.

Download in English
Download in other languages :french

Baromètre éolien 2024

476,6 TWh La production d’électricité éolienne estimée dans l’Union européenne à 27 en 2023
Après des alertes et des doutes, un vent d’optimisme souffle à nouveau sur le marché éolien de l’Union européenne avec pour l’industrie des perspectives de croissance retrouvées. Sur le plan des raccordements, 2023 restera comme une année de transition à la mesure des décisions finales d’investissement prises les années précédentes. Selon EurObserv’ER, pas moins de 15,7 GW ont été installés durant l’année, ce qui, déduction faite des mises hors service, porterait la puissance du parc de l’Union européenne en opération à 218,5 GW.
Hors d’Europe, la Chine impressionne avec un niveau d’installation en 2023 de l’ordre de 76 GW, plus du double de celui de 2022, portant la puissance totale en opération du pays à 441,3 GW fin 2023. Cette croissance hors normes permet pour la première fois à l’éolien de nettement dépasser le seuil des 100 GW installés en une seule année et propulse la puissance éolienne totale installée dans le monde au-delà du térawatt.

Télécharger