Category Archives: 2025

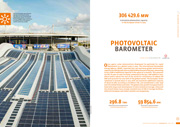
Photovoltaic barometer 2025

306 429.6 mw Cumulative photovoltaic capacity in the European Union in 2024
Once again, solar photovoltaic displayed its aptitude for rapid deployment on a global scale in 2024. The International Renewable Energy Agency, IRENA, reported that net maximum global photovoltaic capacity worldwide had risen to 1 858.6 GW by the end of the year, amounting to 451.9 GW of additional capacity in the space of 12 months. This amounts to a 28.1% year-on-year increase, compared to the 352.7 GW added in 2023. China towers above the rest of the world for installation (it added 278 GW) and accounts for over 60% of the global market. The European Union remained in second place in 2024 with net maximum additional capacity of about 60 GW, according to EurObserv’ER, and established a clear lead over the United States and India. This global solar growth now goes hand in hand with large scale development of electrochemical storage. China and the United States have already installed tens of GW of storage facilities, while the European and Indian markets are burgeoning.

Download in English

23rd annual overview barometer

23rd annual overview barometer Webinar

EurObserv’ER – Webinar
23nd Annual Overview Barometer

EurObserv’ER invites you to watch the recording of our free live webinar, featuring the main results of the recently released Annual Report The State of Renewable Energies in Europe (23rd edition).

Speakers:

  • Diane Lesco: Team leader at Observ-er, presented a general overview of the Observer project, which started in 1999.
  • Uta Zähringer: Moderator, head of the Department of Academic Programs at Renewables Academy, Berlin.
  • Kathia Terzi: Discussed energy indicators, highlighting challenges and progress in installed capacity and energy production.
  • Julia Panny: Researcher at Fraunhofer ISI, presented indicators on renewable energy sources in buildings, focusing on heating and cooling as well as on the self-consumption of photovoltaic installations.
  • Floris Uleman: From TNO Energy Transition, discussed the costs of renewable energies and their competitiveness, as well as the impact on employment and the savings achieved through the reduction of fossil fuel use and greenhouse gas emissions.
  • Ils Moorkens: Researcher at VITO, covered avoided fossil fuel use and avoided greenhouse gas emissions

The webinar presented the key results on:

  • Energy indicators (installed RES in EU-27, RES in buildings)
  • Socio-economic indicators (jobs and turnover gross added value)
  • Investment indicators
  • Renewable energy costs and energy prices
  • Avoided fossil fuel use and resulting avoided costs and GHG emissions
  • Indicators on innovation, competitiveness, and international trade

Join this enlightening session to better understand how Europe is moving towards a more sustainable future through renewable energy.

The recording is already up on our YouTube channel.

EurObserv’ER has been gathering information and data on renewable energy sources in the EU for more than twenty years to describe the state and development of the sectors in themed barometers. The first part of this opus is a summary per RES sector, communicating the main tendencies in each sector for the years 2022 and 2023.

The following chapters supply socioeconomic indicators on employment and turnover, investment costs, avoided fossil fuel use and resulting avoided expenses and GHG emissions thanks to the development of the RES sectors. They also provide for an insight on EU competitiveness and innovation capability regarding renewable energy technologies.

Continue reading

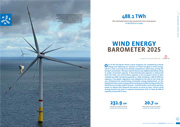
Wind energy barometer 2025

488.1 TWh The estimated electricity production from wind power in the EU of 27 in 2024
One of the European Union’s main weapons for combatting climate change and reducing our reliance on fossil energies is wind energy, which is also a driving force behind competitive electricity pricing for Europe’s economies. The year’s performance was slightly dented by a drop in newly connected capacity. If decommissioned capacity is subtracted from the total, net wind turbine capacity in the European Union to date reached 231.9 GW, having increased by 12.2 GW, including 1.7 GW of offshore capacity. A European regulation was adopted at the end of 2022 that set up a framework for accelerating renewable energy deployment, on the hypothesis that constructing and harnessing renewable energy production facilities are of major public interest. It should make construction permits easier to obtain and relaunch the sector as early as 2025. China’s wind energy market has kept its upward momentum with at least 80 GW of capacity connected in 2024.

Download in English

Baromètre éolien 2025

488,1 TWh La production d’électricité éolienne estimée dans l’Union européenne à 27 en 2024
L’éolien est dans l’Union européenne un des principaux fers de lance de la lutte contre le changement climatique et de la réduction de notre dépendance aux énergies fossiles, tout en permettant à l’économie européenne de bénéficier d’un prix de l’électricité compétitif. Durant l’année 2024, la lame s’est un peu émoussée avec une baisse de la puissance nouvellement raccordée. Après déduction de la puissance mise hors service, la puissance éolienne nette de l’Union européenne a augmenté de 12,2 GW en 2024, dont 1,7 GW maritime, pour atteindre une puissance cumulée de 231,9 GW. L’adoption d’un règlement européen fin 2022 établissant un cadre en vue d’accélérer le déploiement des énergies renouvelables, présumant que la construction et l’exploitation d’énergies renouvelables présente un intérêt public majeur, devrait favoriser l’octroi des permis de construire et relancer la filière dès 2025. En Chine, le marché éolien a continué son ascension avec au moins 80 GW raccordés en 2024.

Télécharger