Category Archives: Barometers in English

22nd annual overview barometer

EurObserv’ER has been gathering information and data on renewable energy sources in the EU for more than twenty years to describe the state and development of the sectors in themed barometers. The first part of this opus is a summary per RES sector, communicating the main tendencies in each sector for the years 2021 and 2022.

The following chapters supply socioeconomic indicators on employment and turnover, investment costs, avoided fossil fuel use and resulting avoided expenses and GHG emissions thanks to the development of the RES sectors. They also provide for an insight on EU competitiveness and innovation capability regarding renewable energy technologies.

Continue reading

Wind energy barometer 2024

476.6 TWh The estimated electricity production from wind power in the EU of 27 in 2023
The European Union wind energy industry has put a spate of alerts and uncertainties behind it as the market bullishly eyes renewed growth prospects. The connection figures for 2023, mark a year of transitioncommensurate with the final investment decisions of previous years. EurObserv’ER’s figure for newly installed capacity installation in 2023 is at least 15.6 GW, which once decommissioned capacity for the year is subtracted, takes European Union capacity in service to 218.5 GW. Leaving Europe aside, China’s annual installation figure more than doubled that of 2022, approaching a stunning 76 GW, and took its total capacity in service by the end of 2023 to 441.3 GW. This exceptional growth enabled wind energy to push its 12-month worldwide installation figure past the 100-GW mark for the first time, and with it thrust the total global wind energy capacity installation figure to over one terawatt.

Download in English
Download in other languages :french

Solid biofuels barometer 2023

-4.1% The decrease of inland consumption from solid biofuels in the EU27 between 2021 and 2022

According to EurObserv’ER, solid biofuel energy consumption, in all its forms (from roundwood to wood pellets, wood waste and by-products, residue, plant and other renewable industrial waste) in the European Union of 27 should settle at about 100.3 Mtoe. This is the second highest annual consumption figure ever recorded in the EU, following 2021 when a new record was made. The slide from the 2021 peak can be attributed first and foremost to the year’s milder average temperatures, which reduced heating needs across the European Union. Furthermore, wood pellet supply circuit pressures hit industrial users, exacerbated by the backdrop of tighter biomass sustainability criteria monitoring, international tensions with Russia and record energy market prices.

Download
Download in other languages : french

RES in Transport barometer 2023

+ 2.0 % The increase of renewable energy consumption for transport in the EU27 between 2021 and 2022 (in energy content)
The preliminary data gathered by EurObserv’ER suggests that renewable energy consumption in European Union transport, be it road, rail, maritime or air transport, driven by combustion or electric engines, increased by about 2.0 % between 2021 and 2022, to almost 19.4 Mtoe. As lockdown measures were gradually lifted in 2021, transport needs returned to normal. The renewable energy share of European Union transport, as defined by the Renewable Energy Directive (known as RED II), should inch forwards towards the 10% threshold through the application of the incentives arising from greater use of advanced biofuels and the development of electrification in road transport.

Download in English
Download in other languages : french

Baromètre énergies renouvelables dans les transports 2023

+ 2,0 % Augmentation de la consommation d’énergies renouvelables dans les transports de l’UE à 27 entre 2021 et 2022 (en contenu énergétique)
Selon les données préliminaires recueillies par EurObserv’ER, la consommation d’énergies renouvelables dans les transports de l’Union européenne, qu’ils soient routiers, ferroviaires, maritimes ou aériens, fonctionnant avec des motorisations thermiques ou électriques, a augmenté de l’ordre de 2,0 % entre 2021 et 2022, à près de 19,4 Mtep. Cette hausse s’est effectuée dans un contexte de retour à la normale des besoins de transport, après une année 2021 encore marquée par la levée progressive des mesures de confinement. Du fait du jeu des bonifications liées à une plus grande utilisation des biocarburants avancés et au développement de l’électrification du transport routier, la part des énergies renouvelables dans les transports de l’Union européenne, telle que définie par la directive énergies renouvelables (dite RED 2), devrait augmenter pour se rapprocher du seuil des 10 %.

Télécharger

Biogas barometer 2023

Biogas Barometer 2023+1.3 % Biogas primary energy production growth in the EU 27 between 2021 and 2022
The initial EurObserv’ER estimates put the European Union’s primary biogas energy output for 2022 at over 15.8 million tonnes of oil equivalent (Mtoe), which amounts to modest annual growth of 1.3% (196 410 tonnes of oil equivalent). Biomethane injection into the natural gas grid has dominated this increase, driven by the proactive policies of a few Member States, primarily France and Denmark. More than a quarter of whose gas consumption is already supplied by biométhane injection in this last country.

Download in English
Download in other languages: french

Solar thermal and concentrated solar power barometer 2023

+ 11.9 % The growth of the solar thermal market in the European Union between 2021 and 2022
The energy crisis that is hitting Europe and worsening climate “overheating” has propelled renewable solar thermal heat encompassing all its components to centre stage, wherever it is applied in the individual and collective residential segment, district heating networks or to meet industrial heat requirements. The sector has picked up over the last two years in a much more promising context – that of the sharp rise in energy prices and the determination of the European Union countries to wean themselves off imports of Russian natural gas. According to EurObserv’ER, the solar thermal market recovery triggered in 2021 was confirmed in 2022 with 11.9% growth in the annual installed capacity figure, i.e., 1 660.7 MWth installed. This capacity equates to a collector area of almost 2.4 million m2. Only a single thermodynamic solar power plant (also known as a concentrated solar power plant) was commissioned in Europe in 2022, making it a slow year. The plant in question, the SOLINPAR CSP plant is in Italy, and takes the country’s concentrated solar power capacity to 12.4 MW and the European Union’s CSP capacity to 2 333.1 MW.

Download in English
Download in other languages : french

Photovoltaic barometer 2023

195 413.2 mw Cumulative photovoltaic capacity in the European Union in 2022
Solar photovoltaic energy is keeping its shine. Initial assessments of the net maximum capacity connected to grids worldwide in the twelve months to the end of 2022 indicate at least 191.5 GWac (ac for alternative current), which would take global capacity up to 1 046.6 GWAC. The expansion of industrial module and electrochemical storage manufacturing capacities is hastening solarization of the global electricity mix. The European Union, having connected at least 32.8 GWac of net maximum capacity in 2022 and 195.4 GWac of capacity to date, is eyeing new heights. Its combined solar power output of 205.2 TWh, boosted by the record sunshine levels of 2022, increased by 29.6% (by 46.9 TWh) on its 2021 performance.

Download in English

Wind energy barometer 2023

419.5 TWh The estimated electricity production from wind power in the EU of 27 in 2022
The European Union’s wind energy sector is still on track despite the disappointing state of the winds. EurObserv’ER puts newly installed capacity in 2022 at about 15 GW, including 963 MW of offshore capacity. Once the capacity of decommissioned turbines is subtracted, and replacements by more powerful units is allowed for, the net additional wind turbine capacity figure increased by at least 14.4 GW in the twelve months to the end of 2022, which amounts to 28% growth on the 2021 level (11.3 GW). While this result is a step in the right direction, the growth pace is too slow to meet the European Union’s renewable energy production targets. In 2022, wind power output picked up again after the turmoil of 2021, increasing by 8.4% to 419.5 TWh (i.e., 32.6 TWh more than in 2021).

Download in English
Download in other languages : french

21st annual overview barometer

In 2021, renewable energies covered 21.8% of gross final energy consumption in the EU-27. The target set in the 2008 climate and energy package has thus been exceeded and we can only welcome this at a time when it is fashionable to cast doubt on the benefits of European integration.

This is all the more valid because in doing so, Europe has proved that it can come up with initiatives and coordination in a field, that of energy, despite being under the Member States’ remit.

(more…)

Solid biofuels barometer 2022

+8.1% The growth of inland consumption from solid biofuels in the EU27 between 2020 and 2021

European Union solid biofuels energy consumption reached new peaks in 2021, and this trend extends to all forms from log wood, to pellets, wood waste and by-products. EurObserv’ER puts this 2021 figure at 104.2 Mtoe, which amounts to a 8.1% year-on-year rise. This growth spurt can be ascribed to a 7.8 Mtoe increase in consumption driven by a harsher 2020-2021 winter, a longer heating period in the main European Union climate zones, and by the hike in fossil energy prices in the second half of the year that made biomass fuels more competitive. Additional consumption is recorded in the European Union figures for both solid biofuels electricity output, which grew by 9.7 TWh and heat consumption which increased by almost 6.1 Mtoe over the previous winter’s level.

Download
Download in other languages : french

RES in Transport barometer 2022

+ 4.3 % The increase of biofuels consumption for transport in the EU27 between 2020 and 2021 (in energy content)
The gradual lifting of lockdown restrictions during 2021 naturally led to increases in energy consumption in transport and with it the corresponding renewable biofuel or electricity shares. Preliminary estimates suggest that EU-27 biofuel consumption rose by about 4.3% between 2020 and 2021 at over 17 Mtoe (million tonnes equivalent of oil). The bioethanol share of this growth (11.0%) was stronger than that of biodiesel (2.2%). Biofuel consumption was boosted by the new Renewable Energies Directive (RED II), which devised a new computing method for measuring renewable electricity consumption in transport. This new methodology establishes this consumption at 21.9 TWh in 2021, equivalent to 1.9 Mtoe.

Download in English
Download in other languages : french

Ocean Energy Barometer 2022

249.2 MW Projects using ocean energies having been active during the year 2021 in EU 27
Marine energy, also known as ocean energy, offers coastal countries significant diversification potential for their electricity mixes. Competition in the European sector is rife with companies trying to outdo each other and impose their marine turbine or wave energy converter concepts for mass production. The tidal stream sector, which uses ocean current energy, has opened up a slight lead by launching its first commercial projects to benefit from power purchase agreements. It is currently collecting feedback on its full-scale prototypes, i.e., MW “commercial” size turbines. The wave energy converter (WEC) sector is hard on its heels, testing prototypes dimensioned at several hundred kW adapted to deal with differing European coastal wave conditions.

Download in English
Download in other languages : french

20th annual overview barometer

EurObserv’ER has been gathering information and data on renewable energy sources in the EU for more than twenty years to describe the state and development of the sectors in themed barometers. The first part of this opus is a summary per RES sector, communicating the main tendencies in each sector and the official Eurostat figures from Eurostat database available on the 25 January 2022 download.

The following chapters supply socioeconomic indicators on employment and turnover, investment costs, avoided fossil fuel use and resulting avoided expenses and GHG emissions thanks to the development of the RES sectors. They also provide for an insight on EU competitiveness and innovation capability regarding renewable energy technologies.

(more…)

Photovoltaic barometer 2022

158 911.4 mw Cumulative photovoltaic capacity in the European Union in 2021
The solar photovoltaic market upturn held up well in spite of the increase in energy and solar system component prices that characterised 2021 across the globe. The International Renewable Energy Agency (IRENA) put worldwide maximum net installed solar capacity at 843.1 GW at the close of the year, which equates to 133.6 GW of new capacity in 12 months. More than half of this additional capacity was installed in Asia (53.7%), while Europe and North America ran neck and neck with 17.2% and 16.5% respectively. The EurObserv’ER consortium’s calculations conclude that the European Union of 27 added maximum net capacity of 22.3 GW, which takes the European base to date to 158.4 GW after subtracting decommissioned capacity.

Download in English
Download in other languages : french   

Wind energy barometer 2022

384.9 TWh The estimated electricity production from wind power in the EU of 27 in 2021
Although an improvement was made on the European Union’s wind energy development 2020 level, the pace is much too low to meet the EU climate targets for 2030. According to EurObserv’ER, the additional capacity installed in the European Union of 27 increased by only 11 GW including 0.6 GW of offshore capacity. The wind energy industry reckons that in order to achieve the new goal being discussed of 40% of renewable energy in final energy consumption in 2030, almost three times as much capacity needs to be installed every year. After enjoying an exceptional year for installation, with 72.1 GW in 2020, China’s installation pace slowed down in 2021 with 47.6 GW of new wind energy capacity. Part of this was 16.9 GW of offshore wind energy, with the result that China now dominates global offshore wind energy market segment.

Download in English
Download in other languages : french

Solid Biofuels barometer 2021

+0.3% The growth of inland consumption from solid biofuels in the EU of 27 between 2019 and 2020
At 94.4 Mtoe, solid biofuels primary energy consumption in the EU of 27 improved marginally – by 0.3% – on its 2019 level in 2020, despite the forebodings about the COVID-19 pandemic and new temperature records. This feat can be credited to an increase in electricity recovery from solid biofuels of about 2 TWh, which rose to 82.6 TWh, contrasting with solid biofuels heat consumption which slipped (by 0.8%) to 76.4 Mtoe.

Download in English
Download in other languages :french

Heat pumps barometer 2021

+3.4% the increase of the heat pump market (all technologies) between 2019 and 2020 in the EU
The public authorities view heat pump technology as one of the keys to achieving carbon neutrality by 2050. Europe’ heat pump industry claims to be ready to rise to the challenge. The European Union-wide HP market data for 2020 confirms that this technology is consolidating its foothold in the heating segment. The reversible air‑to-air HP segment is driven by cooling requirements in the southern countries and by heating requirements in the cold climate countries, making its market trends distinct. Lacklustre performances by Italy’s and Spain’s reversible air-to-air HP segments held back its growth across Europe in 2020.

Download in English
Download in other languages : french

RES in Transport barometer 2021

– 1.5 % The decrease of biofuels consumption for transport in the EU27 between 2019 and 2020 (in energy content)
The EU27 Member States’ 2020 deadline for meeting their renewable energy targets for the transport sector passed in an exceptional context overshadowed by the COVID-19 pandemic which dramatically reduced mobility requirements. Nonetheless, the initial available estimates point to the fact that biofuel consumption in the EU of 27 contracted only slightly in 2020 (by 1.5% year-on-year) because its use was supported by the increase in incorporation rates required to achieve the year’s 10% target for renewable energy in transport. The drop in renewable electricity consumption by railway transport was partly offset by the sharp rise in the number of electric vehicles on the road.

Download in English
Download in other languages : french

Solar thermal and concentrated solar power barometer 2021

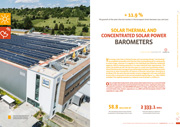
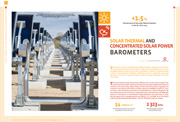
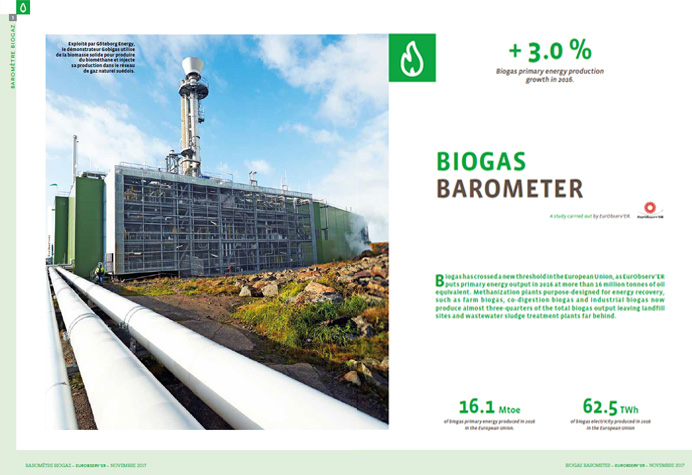
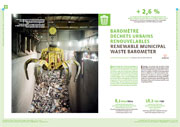
– 15.3% The decrease of the solar thermal market in the European Union in 2020
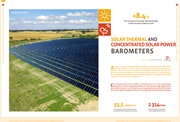
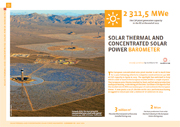
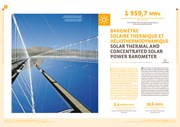
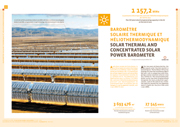
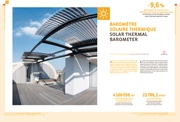
On balance, the European solar thermal sector put in a poor performance in 2020, as it compared badly with 2018 and 2019, when the sector seemed to be getting back on its feet. EurObserv’ER reports that the installed surface in the countries of the European Union to 27 is down by 15.3% compared to 2019, just under 2 million m2. The Covid pandemic is not the only reason for the sector’s troubles but should bear part of the blame for the slowdown observed in several national markets during the first half year. Other solar thermal markets, such as Germany’s, finally returned to growth, driven by the country’s restated political insistence on decarbonising its heating and domestic hot water production needs.

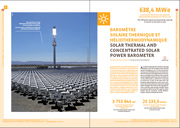
Concentrated Solar Power (CSP) plants cover all the technologies devised to transform solar radiation energy into very high temperature heat for onward conversion into electricity. CSP development is being pursued in countries that offer suitably propitious sunlight conditions, such as China, Chile, India, South Africa, the Middle East, and the Maghreb. The only a sizeable production sector in Europe is that of Spain, and after champing at the bit for many years, the Spanish sector expects an initial tender for at least 200 MW to be launched in 2021.

Download in English
Download in other languages : french

Solid biomass barometer 2020

Biomass Solid+2.2% The evolution of inland consumption from solid biofuels in the EU 28 between 2018 and 2019

Solid biofuels energy consumption was 2.2% higher in 2019, reaching 102.6 Mtoe in the EU28 countries, according to EurObserv’ER. Leaving aside the UK, the consumption figure was 94.5 Mtoe and posted 1.8% growth. The increment can be ascribed to both a significant rise in the electricity output of several countries and also to about 1.1% of additional heat consumption with or without the UK’s consumption.

Download
Download in other languages : french

Biogas barometer 2020

BaroBiogaz2020+ 0,7 % Biogas primary energy production growth in the EU 28 between 2018 and 2019
Primary energy production from biogas in the EU28 countries has increased only slightly since 2017. According to EurObserv’ER, output reached 16.6 Mtoe in 2019, which is marginally higher than in 2018, butaround the same level as in 2017. The rollout of regulations less supportive of using food-type energy crops for producing biogas has fuelled this general trend and has been compounded by the limitation on the capacity allocated to biogas tenders and less attractive biogas electricity payment terms. Nonetheless some member countries have posted positive output growth, thanks to their determination to both encourage biomethane injection and recover energy from fermentable waste.

Download in English

Heat pumps barometer 2020

+12.6% the increase of the heat pump market in the EU28 between 2018 and 2019
A study carried out by EurObserv’ER. The heat pump market of the European Union of 28 continued its upward trend in 2019 buoyed by the political determination of some Member States to decarbonize their heat requirements and by the increasing demand for summer relief from the recurrent heat waves. According to EurObserv’ER, about 3.9 million HPs were sold in 2019, which amounts to 12.6% annual growth. The European Union now has an installed base of about 40 million HPs, all technologies taken together, producing renewable heating and cooling.

Download in English
Download in other languages : french

Biofuels barometer 2020

+ 6.8 % The increase of biofuels consumption for transport in the EU28 between 2018 and 2019 (in energy content)
Last year, biofuel consumption used in transport in the European Union of 28 increased by just over 1.1 million tonnes oil equivalent (Mtoe). According to EurObserv’ER, it should stabilize at 17.8 Mtoe in 2019, as against 16.7 Mtoe in 2018, which is a 6.8% increase. This growth is directly linked to the increase in certain member countries’ incorporation mandates, through policies implemented to achieve the binding 10% target of renewable energies in the transport sector by the end of 2020.

Download in English

Solar thermal and concentrated solar power barometer 2020

+1.5 % The increase of the solar thermal market in the EU 28 in 2019
The European Union solar thermal market for heat, heating, and domestic hot water production held up well in 2019. Initial estimates put the total installed collector area at just under 2.3 million m2, which is a slight increase (1.5%) on its 2018 level. However, individual country situations vary, and the sector still has to reinvent itself to meet the huge challenge of climate neutrality.

The term Concentrated Solar Power (CSP) covers all the technologies that aim to transform solar radiation energy into very high temperature heat to convert it into electricity. Most of the current CSP development is going on in countries and regions that offer suitably conducive sunlight conditions, such as China, India, Australia, South Africa, the Middle East, and the Maghreb. The European Union’s new CSP plant installation pace slowed down considerably after an initial flurry concentrated in Spain between 2007 and 2014. In 2019, the European Union gauge moved up slightly to 2 323 MW when the eLLO project in the Pyrénées-Orientales, France, officially came on stream.

Download in English

19th annual overview barometer

EurObserv’ER has been gathering data on European Union renewable energy sources for twenty years to describe the state and development of the sectors in themed barometers. The first part of this opus is a summary of the barometers released in 2019 for the wind energy, solar photovoltaic, solar thermal, CSP, biofuel, ocean energies and solid biomass sectors. The summaries have provided the opportunity to consolidate all the energy indicators with the official (consolidated) 2017 and 2018 data.

(more…)

Photovoltaic barometer 2020

130 670 MW Cumulative photovoltaic capacity in the EU 28 at the end of 2019
The amount of solar photovoltaic capacity installed across the world in 2019 is lower than expected. It will just pass the 100-GW threshold, which is much the same as in 2018 (which the IEA PVPS experts reassessed at 103.6 GW in December 2019), and enough to pass the half-million installed megawatts threshold worldwide. In 2019, the Chinese market’s continuing and greater than forecast decline, was offset by strong growth in the other markets, the United States and European markets in particular. The global Covid-19 pandemic, its effects on the global production, distribution and installation circuits, and the ensuing global economic recession will naturally have an impact on the 2020 market, even if it is too early to quantify.

Download in English

Baromètre Photovoltaïque 2020

130 670 MW La puissance photovoltaïque cumulée
de l’Union européenne à 28 fin 2019

Contrairement aux prévisions plus optimistes, la puissance solaire photovoltaïque installée dans le monde en 2019 devrait finalement se contenter de dépasser légèrement le seuil des 110 GW. Ce volume d’installation, un peu plus élevé que celui de 2018 (qui a été réévalué en décembre 2019 à 103,6 GW par les experts de l’AIE PVPS), devrait toutefois suffire à porter le niveau des installations mondiales nettement au-dessus du seuil des 600 GW. En 2019, la nouvelle baisse, plus franche que prévu, du marché chinois a été contrebalancée par la forte croissance d’autres marchés, états-unien et européen en particulier. La pandémie mondiale du Covid-19, ses conséquences sur les circuits mondiaux de production, de distribution et d’installation et la récession économique mondiale qu’elle va engendrer aura logiquement un impact sur le marché 2020, même si ce dernier est encore difficile à quantifier.

Télécharger en Français
Download in other languages : english

Wind energy barometer 2020

426 TWh The estimated electricity production from wind power in the EU of 28 in 2019
2019 was a good year for the global wind market, which expanded in its three main zones, namely China, the United States and Europe. Given that the UK was still a Member State in 2019, the European Union’s additional capacity was upwards of 12 GW compared to just below 11 GW in 2018. The European Union of 27 (minus the UK) added about 10 GW of capacity in 2019, taking its installed base to 167.6 GW, compared to just over 8.7 GW in 2018.

Download in English

Solid biomass barometer 2019

225-Biomasse-FR-0.3% The growth of inland consumption from solid biomass in the EU between 2017 and 2018

Solid biomass energy consumption trend swings depend on public policies promoting its use, but they are also highly susceptible to weather conditions. In 2018, it was a mixed bag, with variations across its uses. The demand for heat declined in the European Union, due to a milder winter, while there was a rise in electricity production. All in all, the sector’s primary energy consumption was stable (0.3% lower than in 2017) and is still below the 100 Mtoe threshold (99.3 Mtoe).

Download
Download in other languages : french

Ocean Energy barometer 2019

Ocean Energy barometer 2019243,4 MW Capacity of ocean energy officially registered in the EU at the end of 2018
The ocean energy sector has been a beehive of activity over the last three years with many prototypes being submerged off the British, Brittany, North Sea and Mediterranean coastlines. Tidal stream energy leads wave energy conversion and the other technologies in this ocean race. This is the first time that the sector has been specifically monitored for a regular EurObserv’ER theme-based barometer.

Download in English
Download in other languages : french

Biofuels barometer 2019

Biofuels barometer 2018+ 10.1 % The increase of biofuels consumption for transport in the European Union between 2017 and 2018 (in energy content)
In 2018, biofuel consumption for transport in the European Union experienced a two figure growth. According to EurObserv’ER, it reached 17 Mtoe in 2018, compared to 15.4 Mtoe in 2017, which represents an increase of 10.1%, in line with the increase in the incorporation mandates of certain Member States and a secure European legislative framework. Biodiesel, whether conventional (fatty acid methyl esters or FAME) or derived from hydrogenated vegetable oil (HVO), is the main beneficiary of this increase, with consumption increasing by nearly 1.5 Mtoe to reach 13.9 Mtoe in 2018.

Download in English
Download in other languages : french

Solar thermal and concentrated solar power barometer 2019

+8.4 % The increase of the solar thermal market in the European Union in 2018
At long last, after a sluggish decade of decline, the European Union solar thermal market for hot water production and heating applications appears to have returned to growth. According to EurObserv’ER, the 2018 European market posted a rise of some 8.4% compared to 2017, which equates to 2.2 million m2 of newly-installed surface. However, the amounts of growth vary by country and market segment.

Download in English
Download in other languages : french

Photovoltaic barometer 2019

114 549 MW Cumulative photovoltaic capacity
in the European Union at the end of 2018

The global photovoltaic base continues to make inroads across the five continents. At the end of 2018, its capacity exceeded half a million megawatts, which equates to about 100 GW of newly-installed capacity. In 2018, China’s market faltered, while there was a revival in the European Union market and the emerging markets picked up steam.

Download in English

Wind energy barometer 2019

379.3 TWh The estimated electricity production from wind power in the EU in 2018
Data released by the GWEC shows that newly-installed capacity across the globe slipped slightly (by 3.6%) in 2018 with 51.3 GW compared to 53.2 GW in 2017. This additional capacity takes total wind turbine capacity to 591 GW at the end of 2018, including 23 GW of offshore capacity. The most recent drop in the global installation figure – the third in succession – can be put down to significant contraction in the European and Indian markets that was not entirely offset by the return to growth of the Chinese and United States markets.

Download in English

18th annual overview barometer

EurObserv’ER has been gathering data on the European Union’s renewable energy sources for eighteen years for its themebased barometer reports on the state of the sectors and their momentum. The first part of this work is a summary of the barometers published in 2017 for the wind energy, solar photovoltaic, solar thermal, biofuel, biogas and solid biomass sectors.

(more…)

Solid biomass barometer 2018

225-Biomasse-FR+1.7% The growth , gross inland consumption from solid biomass in the EU between 2016 and 2017

Solid biomass energy consumption trends are at the mercy of public policies encouraging its use, but when we look at the heating application, it also correlates to outdoor temperatures, which were fairly mild in 2017. According to the World Meteorological Organization it was the 5th hottest year ever recorded in Europe, which restrained its increase in heating requirements. According to EurObserv’ER, solid biomass heat consumption increased by 1.1 Mtoe in 2017, which is 1.4% more than in 2016, for a total of 79.9 Mtoe. Growth in electricity recovery from solid biomass was stronger in 2017 (2.9%) reaching 94.5 TWh, driven by coal-fired power plant conversions in the UK, Finland and Denmark.

Download
Download in other languages : french

Heat pumps barometer 2018

+4.4% the increase of the heat pump market in the EU between 2016 and 2017
The European heat pump sector has been able to count on solid heating and cooling application markets for several years. The sales data held by EurObserv’ER shows that more than 3.5 million systems were sold in 2017 in the European Union, which amounts to a 4.4% year-on-year increase. Growth would have been much higher had it not been for the slump in the Italian market, Europe’s main market, whose volume is primarily driven by cooling needs.

Download in English
Download in other languages : french

Biofuels barometer 2018

Biofuels barometer 2018+ 9.2 % The increase of biofuels consumption for transport in the European Union between 2016 and 2017 (in energy content)
Agreements on the broad lines of the future renewable energy directive, REDII, have brought the period of uncertainty surrounding the future of biofuel to a close. Its clarifications and the proposed development framework should improve the sector’s structure in the fundamental sense of the forthcoming climate energy package goals… namely in the combat against climate warming. This expected outcome is borne out by the biofuel consumption figures in transport. Following several years of stability, it picked up steam in 2017 (rising by 9.2%), to reach 15.5 Mtoe.

Download in English
Download in other languages : french 

Solar thermal and concentrated solar power barometer 2018

-24,2 % The decrease of the solar thermal market in the European Union in 2017
Solar thermal energy is no doubt the ultimate physical form for transferring heat to water without emitting greenhouse gases or pollutants. Yet in 2017 the sector struggled to survive in the hot water production and heating market. According to EurObserv’ER, the annual solar thermal collector surface area in the European Union dropped below the 2 million m2 mark, i.e. by 24.2% compared to the previous year’s installed surface area. The individual national market figures vary widely, with several countries showing encouraging signs.

Download in English
Download in other languages : french

Photovoltaic barometer 2018

106 606 MW Cumulative photovoltaic capacity in the European Union at the end of 2017
The spectacular growth of solar power based on solid industrial bases, makes photovoltaic one of the mainstays of global energy transition. In 2017, roughly 100 GW was installed worldwide, and just over half of that in China. The global market amounted to slightly less than half the European Union’s installed base. The EU ended the year at 106.6 GW, i.e. 5.6 GW more than in 2016. While at just over 2% in 2017 solar photovoltaic output may still seem negligible on a global level, photovoltaic already supplies about 6% of the electricity mix in Japan, and more than 7% in Germany and Italy.

Download in English
Download in other languages : french

Wind energy barometer 2018

353,5 TWh : estimated electricity production from wind power in the EU in 2017
The global wind energy market contracted for the second year in succession. According to EurObserv’ER, the additional capacity, less decommissioned capacity, should be about 51 GW in 2017, compared to 55.5 GW in 2016. Restrained Chinese market development is the main reason for this downturn. The European Union market witnessed a flurry of activity before the new European Commission regulatory framework came into force. Installed global wind energy capacity passed the half-million MW mark in 2017, i.e. 539 256 MW.

Download in English
Download in other languages : french

17th annual overview barometer

EurObserv’ER has been gathering data on the European Union’s renewable energy sources for eighteen years for its themebased barometer reports on the state of the sectors and their momentum. The first part of this work is a summary of the barometers published in 2017 for the wind energy, solar photovoltaic, solar thermal, biofuel, biogas and solid biomass sectors.

The energy indicators drawn from these barometers have been updated with SHARES data from 26th January and supplemented by data on the sectors for which no individual barometers were published – small hydropower, heat pumps, geothermal energy, concentrated solar power, household refuse incineration and renewable marine energy sources. Continue reading 17th annual overview barometer

Solid biomass barometer 2017

225-Biomasse-FR+3% growth of primary energy consumption from solid biomass in the EU between 2015 and 2016

Although 2016 was globally the hottest year on record for the third time running, it was cooler in some key European Union countries, which resulted in additional heating requirements, and thus wood fuel consumption. This trend pushed European Union solid biomass consumption (excluding charcoal) to the 100-Mtoe threshold in 2016, 98.5 Mtoe to be exact, and a rise of 2.9 Mtoe.

Download

Biogas barometer 2017

BaroBiogaz2017+ 3.0 % Biogas primary energy production growth in 2016.
Biogas has crossed a new threshold in the European Union, as EurObserv’ER puts primary energy output in 2016 at more than 16 million tonnes of oil equivalent. Methanization plants purpose-designed for energy recovery, such as farm biogas, co-digestion biogas and industrial biogas now produce almost three-quarters of the total biogas output leaving landfill sites and wastewater sludge treatment plants far behind.

Download in English
Download in other languages : french

Solar thermal and concentrated solar power barometer 2017

2017-BaroST-Helio-GB-1– 4.6% The decrease of the solar thermal market in the European Union in 2016
The European solar thermal market is still losing pace. According to the preliminary estimates from EurObserv’ER, the solar thermal segment dedicated to heat production (domestic hot water, heating and heating networks) contracted by a further 4.6% in 2016 down to 2.6 million m2. The sector is pinning its hopes on the development of the collective solar segment that includes industrial solar heat and solar district heating to offset the under-performing individual home segment.

Download in English
Download in other languages : french   germany

Biofuels barometer 2017

2017-Baro-Biocarburants-GB-1+1.3 % The increase of biofuels consumption for transport in the European Union between 2015 and 2016 (in energy content)
Biofuel consumption for transport increased slightly in 2016. EurObserv’ER’s preliminary estimates suggest the figure of 14.4 million toe, which equates to 1.3% year-on-year growth. This increase was entirely driven by biodiesel consumption (which rose 2.4% to 11.6 Mtoe), as bioethanol consumption slipped (by 3.1% to 2.6 Mtoe).

Download in English
Download in other languages : french  germany

Wind energy barometer 2017

302.7 TWh The estimated electricity production from wind power in the EU in 2016
The global wind energy market appears to have encountered its initial limits. Since the beginning of the millennium it has expanded almost continuously to achieve 64.4 GW in 2015. Preliminary estimates for 2016 point to sales of 54.2 GW, which is down on the previous year’s performance. Nonetheless, the results were good enough to give double digit growth of 12.4%, which took the global installed base up to 486.7 GW.

Download in English
Download in other languages : french

Photovoltaic barometer 2017

100 935 MWp in the European Union at the end of 2016
Not just a wave, it’s a breaker that has made landfall on the global solar power market, driven by strong Asian and American demand. The global solar photovoltaic market surged past the 76 GW mark in 2016, with peak growth at 50%. The European market seems to have drifted into slack water. It connected only 6.1 GW of additional capacity in 2016 and in doing so slipped below the previous year’s figure of 7.9 GW. The sector’s regulatory framework is being overhauled with a view to integrating more renewably-sourced electricity into the market.

Download in English
Download in other languages : french     germany

Wind energy barometer 2016

303.5 TWh The estimated electric production from wind power in the EU in 2015
The spectacular rise of China’s wind power market that resulted in connecting at least 30.5 GW, catapulted the global installation level to 62.7 GW in 2015– a 22% more than in 2014! The US and German markets also performed very well, the former because its tax credit mechanism remained in force and the latter because many of its offshore wind farms in the North Sea were connected to the grid. Global wind turbine capacity has increased by 17% and now stands at 432.6 GW.

Download in English
Download in other languages : french

Photovoltaic barometer 2016

94,568 MWp in the European Union at the end of 2015
The European Union solar photovoltaic market picked up in 2015 after three successive years of decline. It registered 3% growth over the twelve-month period, by installing 7 226 MW, which took Europe’s installed capacity to date to 94.6 GW. The global market soared by comparison, gaining 25% year-on-year and connecting at least 50 GW, which took global PV capacity past the 227-GW mark.

Download in English
Download in other languages : french

Solar thermal and concentrated solar power barometer 2016

– 8.6% The decrease of the solar thermal market in the European Union in 2015
In 2015, the European Union saw its solar thermal market contract for the seventh year in a row. EurObserv’ER puts sales of solar thermal capacity installed for the heating market (hot water and space heating) at 1 861 MWth, equivalent to a 2.7 million m² of collectors… a further 8.6% decrease on the previous year’s poor performance. Combined solar thermal capacity installed to date in the EU stands at 34.3 GWth, or 49 million m² of collectors.

Download in English
Download in other languages : french

Biofuels barometer 2016

– 1.7% The decrease of biofuels consumption for transport in the European Union between 2014 and 2015 (in energy content)

The European biofuel market is now regulated by the directive, known as ILUC, whose wording focuses on the environmental impact of firstgeneration biofuel development. This long-awaited clarification has arrived against the backdrop of falling oil prices and shrinking European Union biofuel consumption, which should drop by 1.7% between 2014 and 2015, according to EurObserv’ER.

Download in English
Download in other languages : french

Heat pumps barometer 2016

+20% : the increase of the heat pump market in the EU between 2014 and 2015
The heat pump (HP) sector had an excellent year in 2015. Appliance sales taking all heating and cooling market technologies into account, increased by 20% from 2 212 898 units in 2014 to 2 655 331 units in 2015. The emerging trend over the past few years specific to the HP segment for water-borne systems is that air-source HPs are clearly gaining market shares to the detriment of the ground-source HP market, while reversible HPs using air as their vector are taking advantage of record temperatures that have given a boost to the cooling market.

Download in English
Download in other languages : french germany

Solid biomass barometer 2016

+ 6.7% the growth of electricity from solid biomass in the UE between 2014 and 2015

Solid biomass consumption, primarily wood energy, is still largely governed by heating requirements which are climate-dependent. The main factor for the European rebound in solid biomass consumption as primary energy during the winter of 2015 is that it was not as mild across the continent as the previous winter. Leaving aside climatic variations, the use of solid biomass for producing heat or electricity has tended to increase in the European Union, spurred on by European support policies. A new consumption record of 93.8 Mtoe was posted in 2015… a rise of 3.8 Mtoe over 2014.

Download in English
Download in other languages : french germany

16th annual overview barometer

EurObserv’ER has been gathering data on the European Union’s renewable energy sources for seventeen years for its themebased barometer reports on the state of the sectors and their momentum. The first part of this work is a summary of the barometers published in 2016 for the wind energy, solar photovoltaic, solar thermal, heat pump, biofuel and solid biomass sectors. The data drawn from these barometers has been updated and supplemented by data on the sectors for which no individual barometers were published – small hydropower, biogas, geothermal energy, concentrated solar power, household refuse incineration and renewable marine energy sources.

Hence this publication offers a comprehensive energy dimension review of the twelve renewable sectors that are now developed in the European Union on an industrial scale. It also gives for the first time a view of the share of RES heating and cooling in the building stock.

Download in English
Download in other languages : french

Methodology papers related to the 16th annual barometer


Main findings of the 16th overview barometer

Summary brochure

Wind energy barometer 2015

baro-jde16_FR10.1% The growth of the total wind power capacity in the EU in 2014
The 2014 global wind energy market surged and set a new record after the previous year’s slowdown. More than 52 GW of capacity was installed across the world compared to a little less than 37 GW in 2013. Global wind energy took a 41.4% leap in 2014 to culminate in more than 371 GW of installed capacity.

Download in English
Download in other languages : french germany poland croatia

Photovoltaic barometer 2015

EurObservER-Photovoltaic-Barometer-201586 674 MWp in the European Union at the end of 2014
The global photovoltaic market continued to expand between 2013 and 2014, rising from 37.6 GW to almost 40 GW unlike the European Union market that plummeted further. The EurObserv’ER estimate of the European photovoltaic market is about 6.9 GWp in 2014, a 32.3 % drop on 2013, yet three years earlier, in 2011, it hovered around the 22 GWp mark.

Download in English
Download in other languages : french germany

Solar thermal and concentrated solar power barometer 2015

EurObservER-Solar-Thermal-and-CSP-Barometer-2015_mini2 311,5 MWe The CSP plant generation capacity in the EU at the end of 2014
European concentrated solar power capacity remained stable in 2014 and will probably post a negligible increase in 2015. Construction work on a number of new facilities in Italy that are scheduled for commissioning in 2016 and 2017 could commence in the second half of the year. The European solar thermal market for producing heat, domestic hot water and heating has not found the recipe for recovery. According to EurObserv’ER , the market contracted by a further 3.7% from its 2013 level which is the sixth decrease in a row.

Download in English
Download in other languages : french germany germany poland

Biofuels barometer 2015

Biofuel-barometer-2015-cover+ 6.1% The increase of biofuel consumption in European Union transport between 2013 and 2014 (in energy content)

Biofuel consumption for transport picked up in Europe after a year of uncertainty and decline, increasing by 6.1% over 2013, to 14 million toe (Mtoe) according to EurObserv’ER ’s first estimates. However it is still below its 2012 level when 14.5 Mtoe of biofuel was incorporated. Consumption of biofuel that meets the European Renewable Energy directive’s sustainability criteria rose to 12.5 Mtoe, its highest level so far.

Download in English
Download in other languages : french germany croatia poland

Heat pumps barometer 2015

Heat-pumps-barometer-2015-cover10% the increase of the aerothermal air/air heat pump market in the EU between 2013 and 2014
Heat pumps have moved up the ranks of renewable energy-producing heating technologies since the mid-2000s. The EU Member States’ individual market trends are characterised by the technologies used and their heating and cooling needs. More than 1.7 million systems were sold in the European Union in 2014. According to EurObserv’ER, several market factors were responsible for sales dipping slightly below their 2013 level of just under 2 million.

Download in English
Download in other languages : french german poland hr

Solid biomass barometer 2015

EurObservER-Soid-biomass-Barometer-2015_mini+ 4.5% the growth of electricity from solid biomass in the UE between 2013 and 2014

The European Reanalysis and Observations for Monitoring (EURO4M) project experts report that the year 2014 was unusually hot on the European continent, with the highest temperatures on record, following on from 2013 whose winter conditions were also exceptionally mild, and ahead of 2015 which is also set to be very warm. This situation led to a fall in solid biomass consumption for heating across the European Union. In 2014 electricity output increased by 4.5% on its 2013 level to 84.8 TWh, as the vagaries of climate have less impact on demand and it was also boosted by the expansion of biomass cogeneration and new coal-fired power plant conversions.

Download in English
Download in other languages : french germany poland

15th annual overview barometer

For sixteen years now, EurObserv’ER has been collecting data on European Union renewable energy sources to describe the state and thrust of the various sectors in its focus studies or barometers. The first part of this assessment is an updated and completed summary of the work published in 2015 in Systèmes Solaires (Journal de l’Éolien n° 16, Journal du Photovoltaïque n° 13 and Journal des Énergies Renouvelables n° 227, 228 and 229).

This publication provides a complete overview of the twelve renewable sectors. Their performances are compared against the sta-ted goals set out by each country in its National Renewable Energy Action Plan (NREAP). Additionally, for the sixth year running, the EurObserv’ER consortium members have published their annual renewable energy share estimates of overall final energy consumption for each Member State of the European Union. These figures provide preliminary indication of how the various countries are faring along their renewable energy paths and whether their individual trends point to successful achievement of the targets set by European Directive 2009/28/EC.

Download in English
Download in other languages : french

Wind energy barometer 2014

baro-jde14_en10.2 % The growth of the total wind power capacity in the EU in 2013
Global wind energy capacity increased by 12.4 % in 2013 to 318.6 GW (283.4 GW at the end of 2012), while the global market shrank to 35.6 GW shedding 10 GW. Worldwide market contraction is largely attributable to the collapse of the US market, as a result of the eleventh-hour extension of the federal incentive system. The European market also declined because of investors’ lack of confidence in the region’s new policies. If we take the United States and Europe out of the equation, the global market continued to grow, driven by the Chinese and Canadian wind power sectors.

Download in English
Download in other languages : french germany poland romania

Photovoltaic barometer 2014

baro-jdp1178 798 MWp in the European Union at the end of 2013
The global solar photovoltaic market enjoyed a strong revival in 2013. Preliminary estimates put it in excess of 37 GWp, compared to 30 GWp in 2012 and 2011. The solar photovoltaic sector led the annual installed capacity ratings for renewable energies, taking worldwide capacity up to 137 GWp by the end of the year … a 35% year-on-year increase. At global level the high growth markets – China, Japan and America – contrast sharply with the contracting European Union market.

Download in English
Download in other languages : french germany poland romania

Solar thermal and concentrated solar power barometer 2014

BaroSolarThermal20142 311,5 MWe The CSP plant generation capacity in the EU at the end of 2013
The European concentrated solar plant market is set to mark time for a year following efforts to complete construction on 350 MW of CSP capacity in Spain in 2013. The spotlight has switched to Italy which could re-launch the European market within a couple of years. The European solar thermal market for heat and hot water production and space heating, is shrinking all the time. EurObserv’ER reports that the market is in its fifth successive year of contraction in the European Union. It now posts a 10.5% decline on its 2012 performance having struggled to install just over 3 million m2 of collectors in 2013.

Download in English
Download in other languages : french germany poland romania

Biofuels barometer 2014

BaroBio20146.8% the drop in biofuel consumption in European Union transport between 2012 and 2013
The growth of biofuel consumption for use in transport in the European Union (EU -28) has dwindled in the past few years and finally dropped by about 1 million toe (6.8%) between 2012 and 2013 according to EurObserv’ER , to a consumption level of 13.6 million toe. Nevertheless, sustainable biofuel consumption, certified and thus eligible for inclusion in European targets increased slightly by 1.1% to 11.8 Mtoe.

Download in English
Download in other languages : french germany poland romania

Biogas barometer 2014

BaroBiogaz2014+10.2% Biogas primary energy production growth in 2013
The expansion of biogas energy usage has continued across the European Union. According to EurObserv’ER , about 13. 4 million tonnes oil equivalent (Mtoe) of biogas primary energy were produced during 2013, which is 1.2 Mtoe more than in 2012 representing a 10.2% growth. However, the biogas sector’s momentum was more sluggish than in 2012 (16.9% between 2011 and 2012, giving an additional 1.8 Mtoe) and it is expected to lose some of its impetus in 2014 in a number of countries whose sector expansion controlling policy changes will limit the future use of energy crops.

Download in English
Download in other languages : french germany poland hr

Renewable municipal waste barometers 2014

baro224msw+ 0.7 % The growth of primary energy output from renewable municipal waste in the EU relative to 2013
Preliminary estimates compiled by EurObserv’ER suggest that the production of primary renewable energy recovered by household refuse incineration plants in the countries of the European Union, only increased by 0.7% in 2013 to achieve 8.7 million toe. On the bright side of things, heat sales to networks surged, which reflected better use of the primary energy.

Download in English
Download in other languages : french germany poland

Solid biomass barometer 2014

baro225_biomasse+ 6.1% The growth of primary energy production from solid biomass in the UE between 2012 and 2013
Consumption of solid biomass in the European Union increased once again in 2013, this time by 2.9 Mtoe year-on-year to 91.5 Mtoe. However there was no straight-out trend as the increase in demand for solid biomass energy was particularly sharp in France and the UK and to a lesser degree in Spain and in Italy … in deep contrast with the needs of a number of major wood-energy consumers, such as Sweden and Poland, whose consumption slipped.

Download in English
Download in other languages : french germany poland croatia

14th annual overview barometer

This publication provides a complete overview of ten renewable energy sectors, supplemented by two notes on concentrated solar power and ocean energy. Additionally, for the fifth year running, the EurObserv’ER consortium members have published their annual renewable energy share estimates of overall final energy consumption for each Member State of the European Union. This issue also provides with the importance of the sectors in terms of employment and turnover. For the second time, a chapter dedicated to investment in RES sectors in Europe shows how the sectors are making their way through the economic crisis. And finally, selected case studies show what new business models are emerging for the financing of RES projects.

Download in English
Download in other languages : french


Wind power barometer 2013

EurObservER-Wind-power-barometer-2013-baroJde12-fr-eng+12,3 % the growth of the total wind power capacity in the EU in 2012
Wind power makes further inroads into the world’s electricity mix every year. It looks as though global wind power capacity will increase by another 44 184MW in 2012, and so raise global installed capacity to more than 281 GW. Growth in 2012 was driven by the United States, which chalked up a new installation record, and Europe, which remains a safe bet in the world market. The Asian market weakened a little but its potential for this year nonetheless looks bright.

Download in English/French

Photovoltaic Barometer 2013

EurObservER-Photovoltaic-barometer-2013-baroJdpv9-fr-eng68 647,2 MWp in the European Union at the end of 2012
After the euphoria of 2011, the European Union’s photovoltaic market slowed right down in 2012. EurObserv’ER puts newly-connected capacity in 2012 at 16.5 GWp compared to 22 GWp in 2011, which is a 25% slide. At global level the market generally held up, with just over 30 GWp installed, bolstered by the build-up of the America and Asian markets.

Download in English/French

Solar thermal and concentrated solar power barometer 2013

EurObservER-Solar-Thermal-barometer-2013-baro215-fr-eng1 959,7 MWe The CSP plant electrical generating capacity in the EU at the end of 2012
The European concentrated solar power plant market is steeling itself for tough time ahead. The number of projects under construction is a pittance compared with 2012 that was an excellent year for installations (an additional 802.5 MW of capacity recorded). This drop is the result of the moratorium on renewable energy power plants introduced by the Spanish government. The European solar thermal market is hardly any more encouraging. EurObserv’ER holds that it slipped for the fourth year in a row (it dropped 5.5% between 2011 and 2012). The newly-installed solar thermal collector surface area in the EU now stands at 3.4 million m2, far short of its 2008 installation record of 4.6 million m2.

Download in English/French

Biofuels barometer 2013

EurObservER-Biofuels-Barometer-2013+ 2.9% the increase in EU biofuel consumption in transport between 2011 and 2012
Despite the uncertain political context, biofuel consumption growth was firm in the European Union, rising to almost 14.4 million toe in 2012, i.e. a year-on-year increase of 0.4 million toe. However the previous years’ weaker growth trend is confirmed with growth at just 2.9% between 2011 and 2012.

Download in English
Download in other languages : french germany italy poland romania

Heat pumps barometer 2013

baro218_en7.9% the decrease of the heat pump market in the European Union between 2011 and 2012
Demand on the European heat pump market has been a series of peaks and troughs since 2008 after several years of very strong growth. These fluctuations in annual sales affect the whole of Europe, and its individual countries. Sales have been hit by a blend of economic slowdown, financial uncertainties and low new construction figures. The 2012 trend pointed to further decline, because of tighter conditions in some of the key markets. The assessment made by EurObserv’ER of the air source and ground source HP market for domestic heating and cooling shows that sales decreased from 1.79 million units in 2011 to 1.65 million units in 2012, i.e. a 7.9% drop.

Download in English
Download in other languages : french germany poland romania

Solid biomass barometer 2013

EurObservER-Solid-Biomass-Barometer-20135.4% The growth of primary energy production from solid biomass in the EU between 2011 and 2012
Primary energy production from solid biomass is back on the road to growth, which according to EurObserv’ER stood at about 5.4% between 2011 and 2012. Output rose to 82.3 million tonnes of oil equivalent, which is a 4.2 Mtoe improvement on 2011, whose exceptionally mild winter put paid to the sector’s uninterrupted rise since 1999. This growth was enjoyed by all the solid biomass energy application sectors. Heat sales to heating networks increased 12.9% to 7.9 Mtoe in 2012 while electricity production, boosted by coal-fired power station conversions, gained 7.8% to produce 79.5 TWh.

Download in English
Download in other languages : french germany poland romania

13th annual overview barometer

EurObservER-Annual-Overview-2013This publication provides a complete overview of ten renewable sectors, supplemented by two notes on concentrated solar power and ocean energy. Additionally, for the fourth year running, the EurObserv’ER consortium members have published their annual renewable energy share estimates of overall final energy consumption for each Member State of the European Union. This issue also provides with the importance of the sectors in terms of employment and turnover. Finally, for the first time, a chapter dedicated to investment in RES sectors in Europe shows how the sectors are making their way through the economic crisis.

Download in EnglishDownload in other languages : french

Wind power barometer 2012

EurObservER-Wind-power-barometer-2012-baroJde10-fr-eng5,9 % decrease in the EU wind turbine market registered between 2010 and 2011
Notwithstanding the economic crisis affecting most of the globe’s major economies, wind energy continues to gain supporters around the world. Global wind power capacity increased by 40.5 GW between 2010 and 2011 compared to a 39 GW rise between 2009 and 2010, after deduction of decommissioned capacity. By the end of 2011 global installed wind turbine capacity should stand at around 238.5 GW, and much of the world’s growth is being driven by capacity build-up in the emerging markets. In contrast some of the key wind energy markets may be showing fault lines.

Download in English/French

Photovoltaic Barometer 2012

EurObservER-Photovoltaic-barometer-2012-baroJdpv7-fr-eng51 357,4 MWp in the EU at the end of 2011
The global photovoltaic market has continued to expand despite the economic and financial crisis. Capacity in excess of 29 000 MWp was connected in 2011, which is roughly 12 200 MWp more than in 2010. The European Union is still the main hive of installation activity. It added more than 21 500 additional MWp of capacity to the grid last year, while outside the EU, the surging Chinese, American and Japanese markets vouch for the enormous growth potential offered by solar power worldwide.

Download in English/French

Solar thermal and concentrated solar power barometer 2012

EurObservER-Solar-Thermal-barometer-2012-baro209-fr-eng27 545 MWth: the EU’s solar thermal base to date at the end of 2011
After two years of sharp decline, the European solar thermal market is bottoming out. The EurObserv’ER survey findings are that the installation figure fell just 1.9% in comparison with 2010, giving a newly-installed collector area of 3.7 million m2. The concentrated solar power sector has been forging ahead alongside the heat production applications, and at the end of 2011 installed capacity passed the one gigawatt mark in Spain for the first time with 1 157.2 MWe.

Download in English/French

Biofuels barometer 2012

EurObservER-Biofuels-barometer-2012-baro210-fr-eng+ 3,1 % the increase in EU biofuel transport consumption in 2011
The European Union governments no longer view the rapid increase in biofuel consumption as a priority. Between 2010 and 2011 biofuel consumption increased by 3.1%, which translates into 14 million tonnes of oil equivalent (toe) used in 2011 compared to 13.6 million toe in 2010. The European Union’s attention has shifted to setting up sustainability systems to verify that the biofuel used in the various countries complies with the Renewable Energy Directive’s sustainability criteria.

Download in English/French

Biogas Barometer 2012

EurObservER-Biogas-barometer-2012-baro212-fr-eng+ 18,2 % biogas electricity production growth in 2011.
Biogas energy recovery for both electricity and heat application has increased in the European Union. The magnitude of the reduction in the primary energy figure can be played down as it can be explained by a change in reporting method of the main producer country, Germany. New markets are starting to emerge in its footsteps, but the economic crisis and regulatory restrictions do not auger well for their expansion.

Download in English/French

Renewable municipal waste barometer 2012

EurObservER-Renewable-municipal-waste-barometer-2012-baro212-fr-eng+ 2,6 % the growth of primary energy output from renewable municipal waste in the EU relative to 2010.
Energy recovery by incinerating household refuse in the European Union led to renewable energy production of more than 8.2 million tonnes of oil equivalent in 2011, which is a 2.6% increase on 2010. While the increase in waste-to-energy recovery is preferable to using landfills, under no circumstances should this growth be made at the cost of waste prevention and recycling policies.

Download in English/French

Solid biomass barometer 2012

EurObservER-Solid-Biomass-barometer-2012-baro212-fr-eng-2,9 % the growth of primary energy production from solid biomass in the EU between 2010 and 2011.
The winter of 2011 was exceptionally mild, even in Northern Europe, with unusually high temperatures. As a result the demand for firewood and solid biomass fuel was low. The European Union’s primary energy production from solid biomass between 2010 and 2011 contracted by 2.9% slipping to 78.8 Mtoe. Solid biomass electricity production continued to grow, driven by the additional take-up of biomass co-firing.

Download in English/French

12th annual overview barometer

EurObservER-Annual-Overview-2012This publication provides a complete overview of ten renewable sectors, supplemented by two notes on concentrated solar power and ocean energy. Additionally, for the third year running, the EurObserv’ER consortium members have published their annual renewable energy share estimates of overall final energy consumption for each Member State of the European Union. This issue also provides with the importance of the sectors in terms of employment and turnover. A focus on specific regions that were successful in developing RES sectors shows what are motivating factors for investors on the regional level.

Download in English/French

Wind power barometer 2011

EurObservER-Wind-power-barometer-2011-baro201-fr-eng5,8 % decrease in the EU wind turbine market registered between 2009 and 2010
For the first time in 20 years, growth of the global wind power market faltered, stumbling by 5.8% to 35.7 GW in 2010 (37.9 GW in 2009). The North American market has taken a knock and the European market has slowed down. On the other hand Asian market growth has crept up steadily and now has a grip on more than half the global market.

Download in English/French

Photovoltaic Barometer 2011

EurObservER-Photovoltaic-barometer-2011-baro202-fr-eng29327,7 MWp in the EU
The photovoltaic sector is continuing on track, just as the extent of solar energy’s electricity-generating potential is dawning on the public mind. The annual global installation figure was up more than twofold in 2010 (rising from just short of 7 000 MWp in 2009). It leapt to over 16 000 MWp, bringing worldwide installed photovoltaic capacity close to 38000 MWp.

Download in English/French

Solar thermal and concentrated solar power barometer 2011

EurObservER-Solar-Thermal-barometer-2011-baro203-fr-eng638,4 MWe The CSP plant electrical generating capacity
in the EU at the end of 2010

As could be expected, the recession cast long shadows over the European solar thermal market throughout 2010. For the second year running, new installations for hot water production and space heating (collectors) decreased. According to the EurObserv’ER survey the newly-assigned surface area was 3.8 million m2 in 2010, down from 4.2 million m2 in 2009 and 4.6 million m2 in 2008. At the same time, the European high-temperature solar sector related to electricity production has been taking shape alongside the heat-producing applications, with 638.4 MW already installed. Spain accounts for almost all of this capacity, and a further five EU countries, mostly Mediterranean, intend to develop the sector.

Download in English/French

Biofuels barometer 2011

EurObservER-Biofuels-barometer-2011-baro204-fr-eng13,6 % the increase in EU biofuel consumption in 2010
In 2010 biofuel continued to gnaw away at petrol and diesel consumption in the European Union. However its pace backs the assertion that EU biofuel consumption growth slackened off. In the transport sector, it increased by only 1.7 Mtoe compared to 2.7 Mtoe in 2009. The final total biofuel consumption figure for 2010 should hover at around 13,9 Mtoe.

Download in in English/French

Ground-source heat pump barometer 2011

EurObservER-Ground-source-heat-pump-barometer-2011-baro205-fr-eng2,9% slide by the GHSP market in the EU between 2009 and 2010
The double whammy dealt by the economic crisis and housing slump has stifled expansion of the ground-source heat pump market in many European countries. The European Union market contracted for the second year running (by 2.9% between 2009 and 2010), and this despite the fact that more than 100 000 units were sold over the twelve-month period, taking the number of installed units past the one million mark.

Download in English/French

Solid biomass barometer 2011

EurObservER-Solid-Biomass-barometer-2011-baro206-fr-eng+ 8 % The growth of primary energy production from solid biomass in the EU between 2009 and 2010
The european Union Member states’ political resolve to develop the energy potential of solid biomass has started to pay off, as in 2010 there were clear signs that growth of primary energy production had quickened pace. The output figure rose to 79.3 Mtoe in 2010, which is 8% up on 2009 and deserves comparison with the previous year’s 4% rise (from 70.6 Mtoe in 2008). The trend, which was driven deeper by europe’s particularly cold winter of 2009-2010, demonstrates that the economic downturn failed to scuttle the Member states’ efforts to structure the solid biomass sector.

Download in English/French

11th annual overview barometer

EurObservER-Annual-Overview-2011For over ten years now, EurObserv’ER has been collecting data on European Union renewable energy sources to describe the state and thrust of the various sectors in its thematic barometers. The first part of this assessment is an updated and completed summary of the work published in 2011 in Systèmes Solaires (Journal des Énergies Renouvelables nos. 203, 204, 205 and 206, Journal de l’Éolien no. 8 and Journal du Photovoltaïque no.5). It provides a complete overview of the ten renewable sectors, supplemented by two summary notes on concentrated solar power and ocean energies. Their performances are compared against the 2020 targets of the European Commission directive and the Renewable Energy National Action Plan targets. This edition also provides a monitoring of socio-economic indicators (employment and turnover) for all sectors and for the 27 countries of the European Union. This 11th edition includes a new chapter with seven regional cases that have succeeded in attracting private investments in their territories to develop projects based on renewable technologies.

Download in English/French

Wind power barometer 2010

Cover Wind power barometer 2010+13,3% EU wind turbine market growth between 2008 and 2009
The global wind power market not only repelled the strictures of the financial crisis,but according to initial estimates, saw the installation of 37 GW, which is almost 10 GW up on 2008. China and the United States registered particularly steady growth and the European Union also picked up momentum to break its installation record.

Download in English/French

Solar thermal barometer 2010

EurObservER-Solar-Thermal-barometer-2010-baro197-fr-eng22 786,1 MWth in the EU
In 2008, the European solar thermal market put on a strong spurt only to mark time in 2009 with about 4.2 million m2 installed, which is 443 708 m2 less year-on-year. The economic crisis has had a ripple effect on the European market in the shape of the Euro crisis at the beginning of May, so the slump seems set to continue on into 2010.

Download in English/French

Biofuels barometer 2010

EurObservER-Biofuels-barometer-2010-baro198-fr-eng12.1 Mtoe of biofuels consumed in the transport sector in the EU in 2009
European Union biofuel use for transport reached the 12 million tonnes of oil equivalent (mtoe) threshold during 2009, heralding a further drop in the pace of the sector’s growth, which rose by only 18.7% between 2008 and 2009 – just 1.9 mtoe of consumption over the previous year. The biofuel incorporation rate in all fuels used by transport in the EU is unlikely to pass 4% in 2009, which is a very long way short of the 5.75% goal for 2010 set in the 2003 European biofuel directive, which would require around 18 mtoe of biofuel use.

Download in English/French

Renewable municipal waste barometer 2010

EurObservER-Renewable-municipal-waste-barometer-2010-baro200a-fr-eng7,7 Mtep of primary energy produced from the combustion of renewable municipal waste in the European Union in 2009
Approximately half the energy produced in Union European’s municipal waste incinération plants is obtained from fermentescible waste (ie biomass waste). To date, incinération is still the main energy conversion channel for renewable municipal waste, for in 2009, biomass energy output stood at 7.7 million toe, which is a 3.3% increase on 2008. Furthermore, this amount could be doubled, assuming a constant level of waste, by investing in modernisation and combustion efficiency improvements.

Download in English/French

Biogas Barometer 2010

EurObservER-Biogas-barometer-2010-baro200b-fr-eng8,3 Mtep of primary biogas energy produced in 2009 in the EU
The biogas sector has never before aroused so much attention as it does today. Elected officers and investors’ interest has been fired by the gradual introduction of regulatory restrictions on the treatment of organic waste and the renewable energy commitments recently made by the european Union member states. The biogas sector is gradually deserting its core activities of waste cleanup and treatment and getting involved in energy production, with so much enthusiasm that in some countries its scope of action has extended to using energy crops. Across the european Union, the sector’s progress is as clear as daylight, as in 2009, primary energy growth leapt by a further 4,3%.

Download in English/French