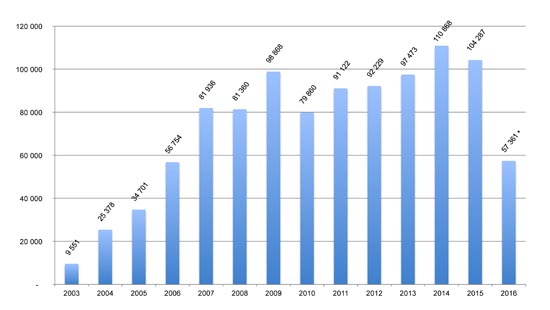

 +13,3% EU wind turbine market growth between 2008 and 2009
The global wind power market not only repelled the strictures of the financial crisis,but according to initial estimates, saw the installation of 37 GW, which is almost 10 GW up on 2008. China and the United States registered particularly steady growth and the European Union also picked up momentum to break its installation record.
Category Archives: 2010
Photovoltaic Barometer 2010
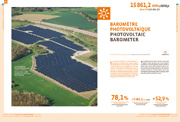 15861,2 MWp in the EU
The global photovoltaic market expanded again in 2009. Germany set a new system installation record while the capacity build-up of the major solar photovoltaic markets contained the fallout generated by the Iberian market derailment. The European Union has the highest photovoltaic plant capacity, with almost 5.5 GWp installed in 2009.
Solar thermal barometer 2010
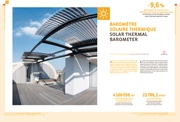 22 786,1 MWth in the EU
In 2008, the European solar thermal market put on a strong spurt only to mark time in 2009 with about 4.2 million m2 installed, which is 443 708 m2 less year-on-year. The economic crisis has had a ripple effect on the European market in the shape of the Euro crisis at the beginning of May, so the slump seems set to continue on into 2010.
Biofuels barometer 2010
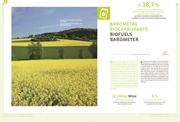 12.1 Mtoe of biofuels consumed in the transport sector in the EU in 2009
European Union biofuel use for transport reached the 12 million tonnes of oil equivalent (mtoe) threshold during 2009, heralding a further drop in the pace of the sector’s growth, which rose by only 18.7% between 2008 and 2009 – just 1.9 mtoe of consumption over the previous year. The biofuel incorporation rate in all fuels used by transport in the EU is unlikely to pass 4% in 2009, which is a very long way short of the 5.75% goal for 2010 set in the 2003 European biofuel directive, which would require around 18 mtoe of biofuel use.
Renewable municipal waste barometer 2010
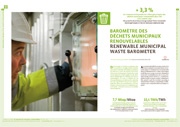 7,7 Mtep of primary energy produced from the combustion of renewable municipal waste in the European Union in 2009
Approximately half the energy produced in Union European’s municipal waste incinération plants is obtained from fermentescible waste (ie biomass waste). To date, incinération is still the main energy conversion channel for renewable municipal waste, for in 2009, biomass energy output stood at 7.7 million toe, which is a 3.3% increase on 2008. Furthermore, this amount could be doubled, assuming a constant level of waste, by investing in modernisation and combustion efficiency improvements.
Biogas Barometer 2010
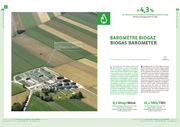 8,3 Mtep of primary biogas energy produced in 2009 in the EU
The biogas sector has never before aroused so much attention as it does today. Elected officers and investors’ interest has been fired by the gradual introduction of regulatory restrictions on the treatment of organic waste and the renewable energy commitments recently made by the european Union member states. The biogas sector is gradually deserting its core activities of waste cleanup and treatment and getting involved in energy production, with so much enthusiasm that in some countries its scope of action has extended to using energy crops. Across the european Union, the sector’s progress is as clear as daylight, as in 2009, primary energy growth leapt by a further 4,3%.
Solid biomass barometer 2010
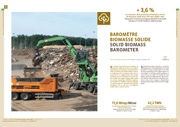 72,8 Mtep primary energy production from solid biomass in the EU in 2009
Solid biomass leaves the other renewable energy sources standing in terms of use and potential. Primary energy output from solid biomass combustion rose in 2009 yet again to a new height of 72.8 Mtoe, which equates to a 3.6% increase on 2008. The reason for this exploit, which prevailed over the tight economic context, is the resolve made by many countries to rely on this energy to achieve their european electricity or heat production target levels.